 3
3peptides
spectra
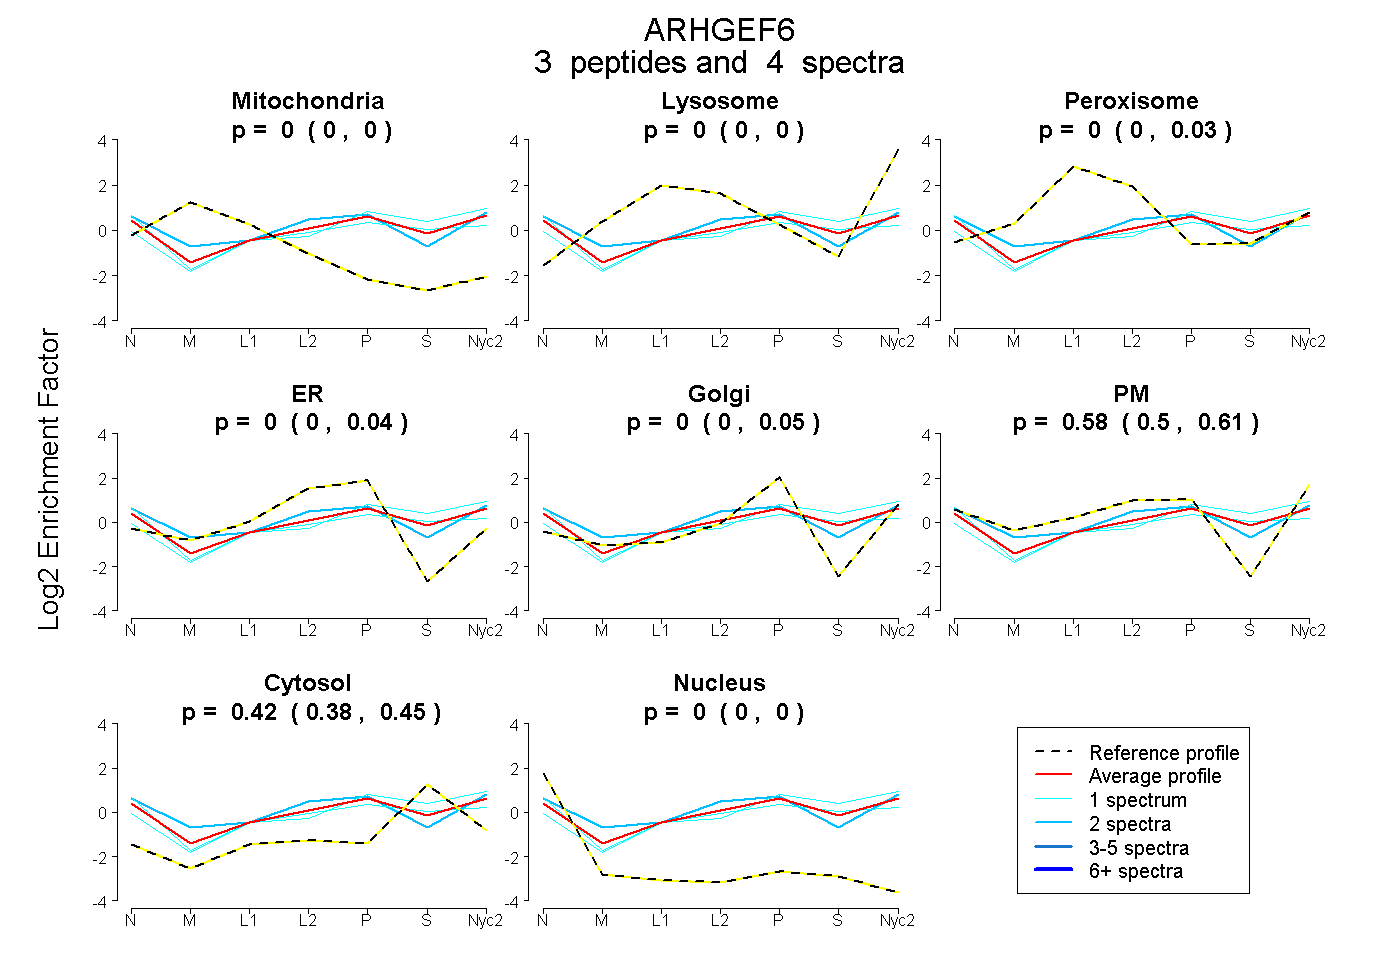
0.000 | 0.000
0.000 | 0.000
0.000 | 0.026
0.000 | 0.043
0.000 | 0.053
0.500 | 0.607
0.376 | 0.448
0.000 | 0.000
| Plot | Mito | Lyso | Perox | ER | Golgi | PM | Cytosol | Nucleus | |||||
| Expt A |
3 peptides |
4 spectra |
|
0.000 0.000 | 0.000 |
0.000 0.000 | 0.000 |
0.000 0.000 | 0.026 |
0.000 0.000 | 0.043 |
0.000 0.000 | 0.053 |
0.580 0.500 | 0.607 |
0.420 0.376 | 0.448 |
0.000 0.000 | 0.000 |
| 1 spectrum, SPENQHK | 0.000 | 0.000 | 0.000 | 0.000 | 0.000 | 0.508 | 0.481 | 0.012 | ||
| 1 spectrum, VPIAGMVVTR | 0.000 | 0.080 | 0.000 | 0.000 | 0.149 | 0.297 | 0.474 | 0.000 | ||
| 2 spectra, AIIAFK | 0.000 | 0.000 | 0.002 | 0.000 | 0.000 | 0.705 | 0.294 | 0.000 |
| Plot | Lyso | Other | |||||||||||
| Expt C |
2 peptides |
2 spectra |
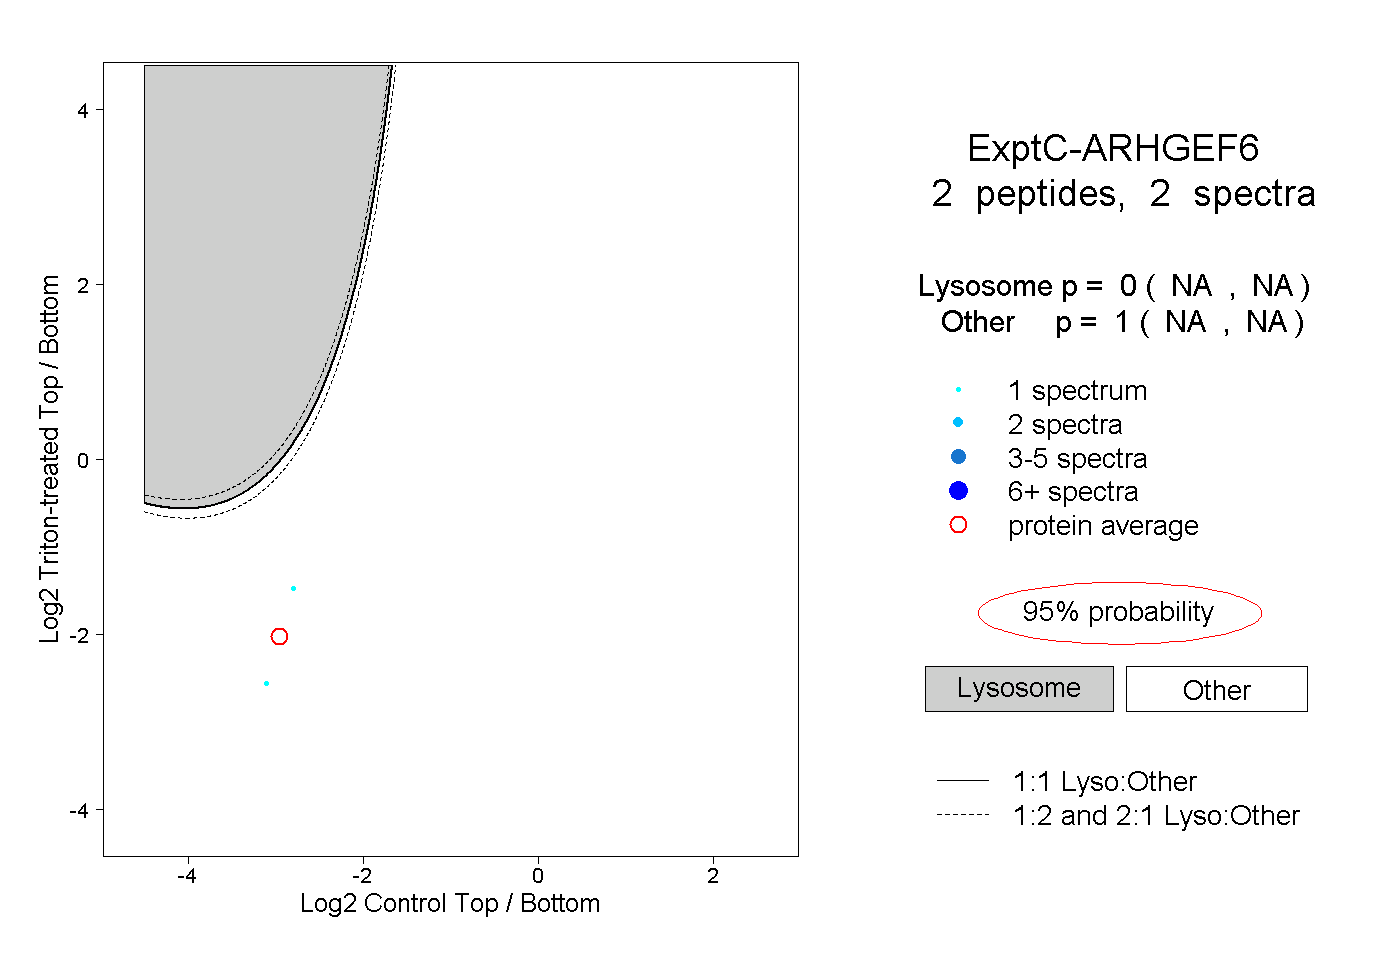 |
0.000 NA | NA |
1.000 NA | NA |