 4
4peptides
spectra
0.000 | 0.000
0.000 | 0.000
0.000 | 0.000
0.000 | 0.107
0.101 | 0.225
0.000 | 0.000
0.015 | 0.060
0.720 | 0.753
| Plot | Mito | Lyso | Perox | ER | Golgi | PM | Cytosol | Nucleus | |||||
| Expt A |
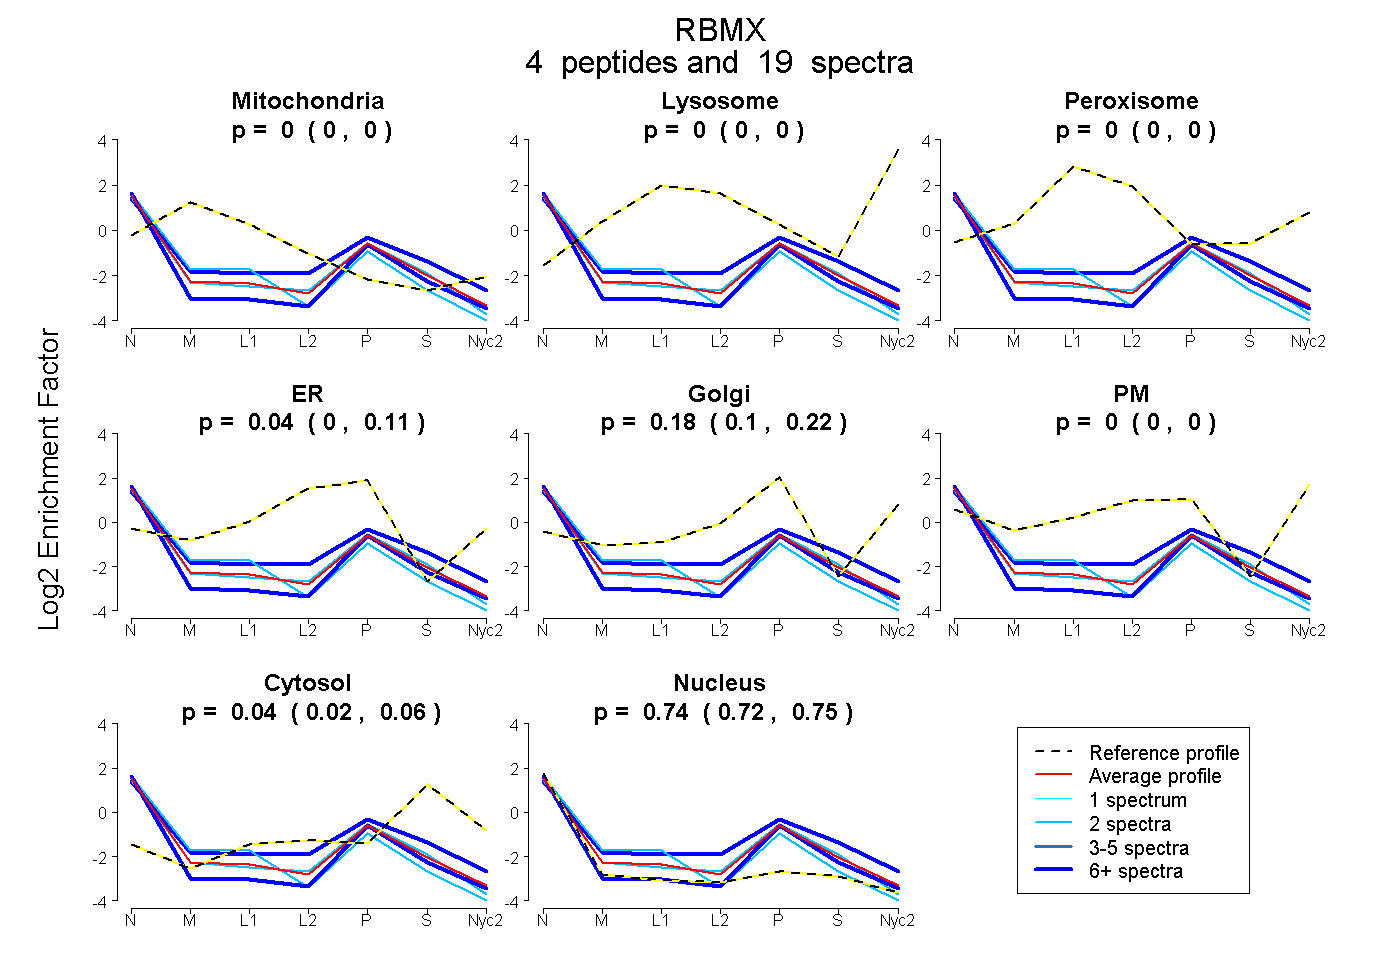
4 peptides |
19 spectra |
|
0.000 0.000 | 0.000 |
0.000 0.000 | 0.000 |
0.000 0.000 | 0.000 |
0.044 0.000 | 0.107 |
0.178 0.101 | 0.225 |
0.000 0.000 | 0.000 |
0.039 0.015 | 0.060 |
0.739 0.720 | 0.753 |
| 8 spectra, DGYGGPPR | 0.000 | 0.000 | 0.000 | 0.228 | 0.061 | 0.000 | 0.158 | 0.553 | ||
| 7 spectra, SAPSGPVR | 0.000 | 0.000 | 0.000 | 0.000 | 0.156 | 0.000 | 0.000 | 0.844 | ||
| 2 spectra, IVEVLLMK | 0.000 | 0.000 | 0.000 | 0.148 | 0.034 | 0.000 | 0.062 | 0.756 | ||
| 2 spectra, DSYTSSR | 0.134 | 0.000 | 0.000 | 0.079 | 0.017 | 0.000 | 0.000 | 0.770 |
| Plot | Mito | Lyso or Perox | ER | Golgi | PM | Cytosol | Nucleus | ||||||
| Expt B |
1 peptide |
1 spectrum |
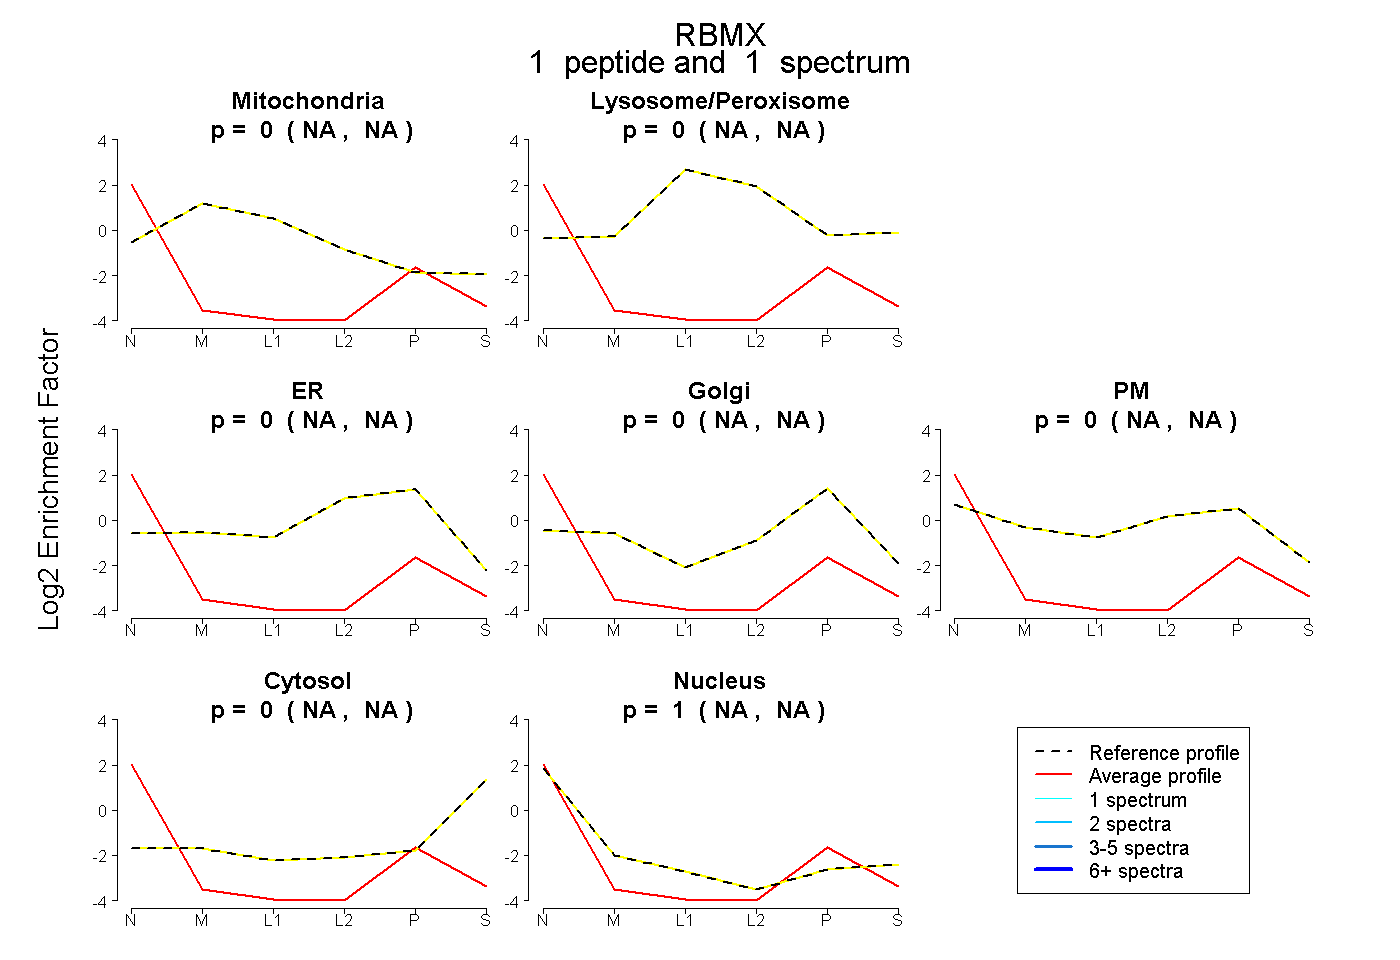 |
0.000 NA | NA |
0.000 NA | NA |
0.000 NA | NA |
0.000 NA | NA |
0.000 NA | NA |
0.000 NA | NA |
1.000 NA | NA |