 5
5peptides
spectra
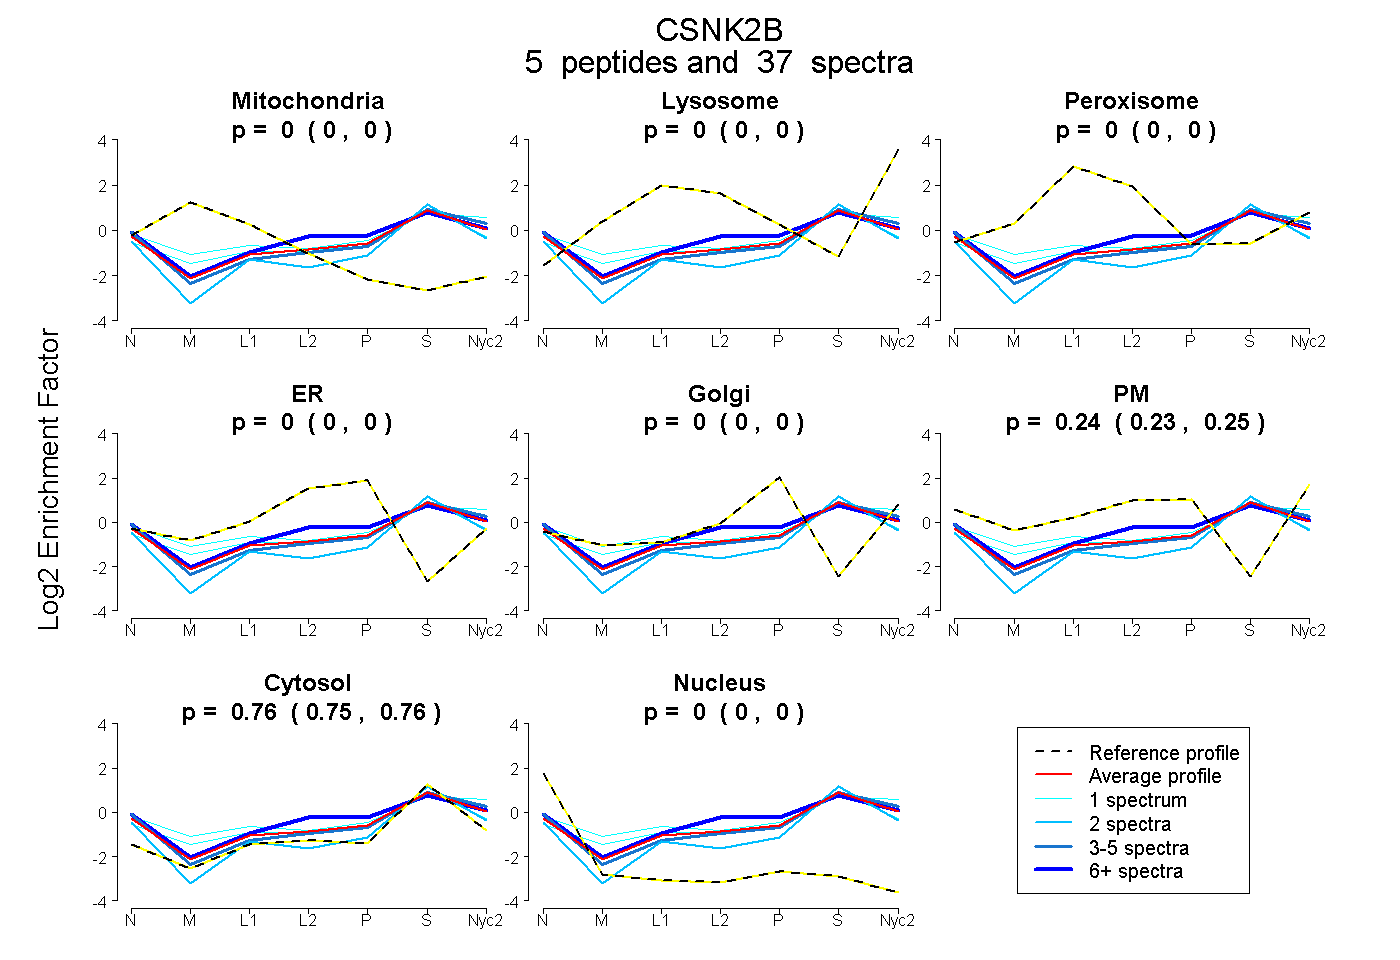
0.000 | 0.000
0.000 | 0.000
0.000 | 0.000
0.000 | 0.000
0.000 | 0.000
0.234 | 0.250
0.749 | 0.765
0.000 | 0.000
2peptides
spectra
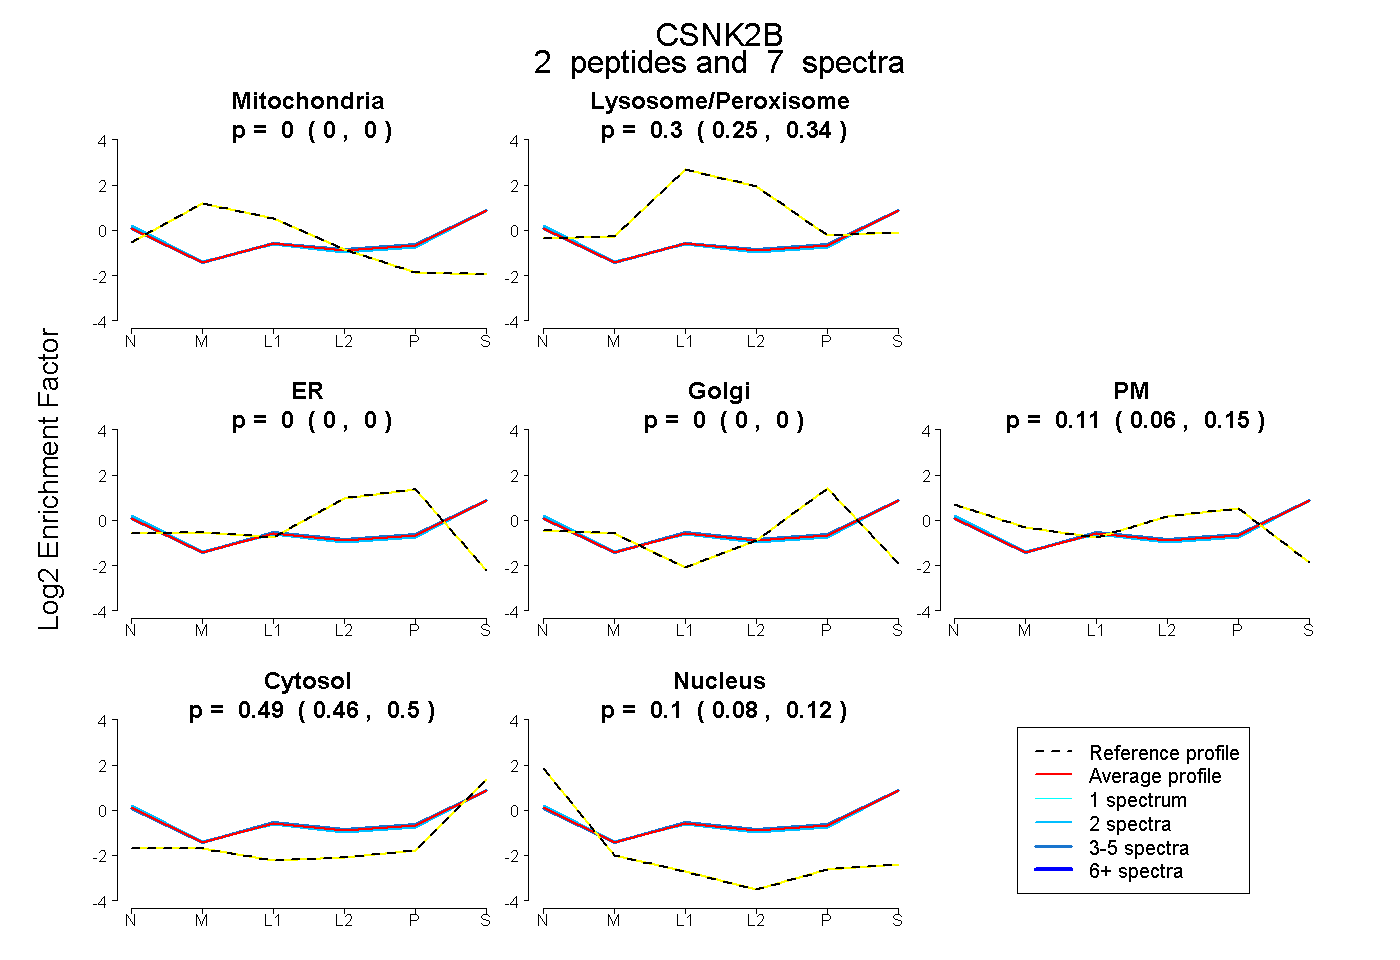
0.000 | 0.000
0.253 | 0.343
0.000 | 0.000
0.000 | 0.000
0.060 | 0.154
0.464 | 0.505
0.075 | 0.120
5peptides
spectra
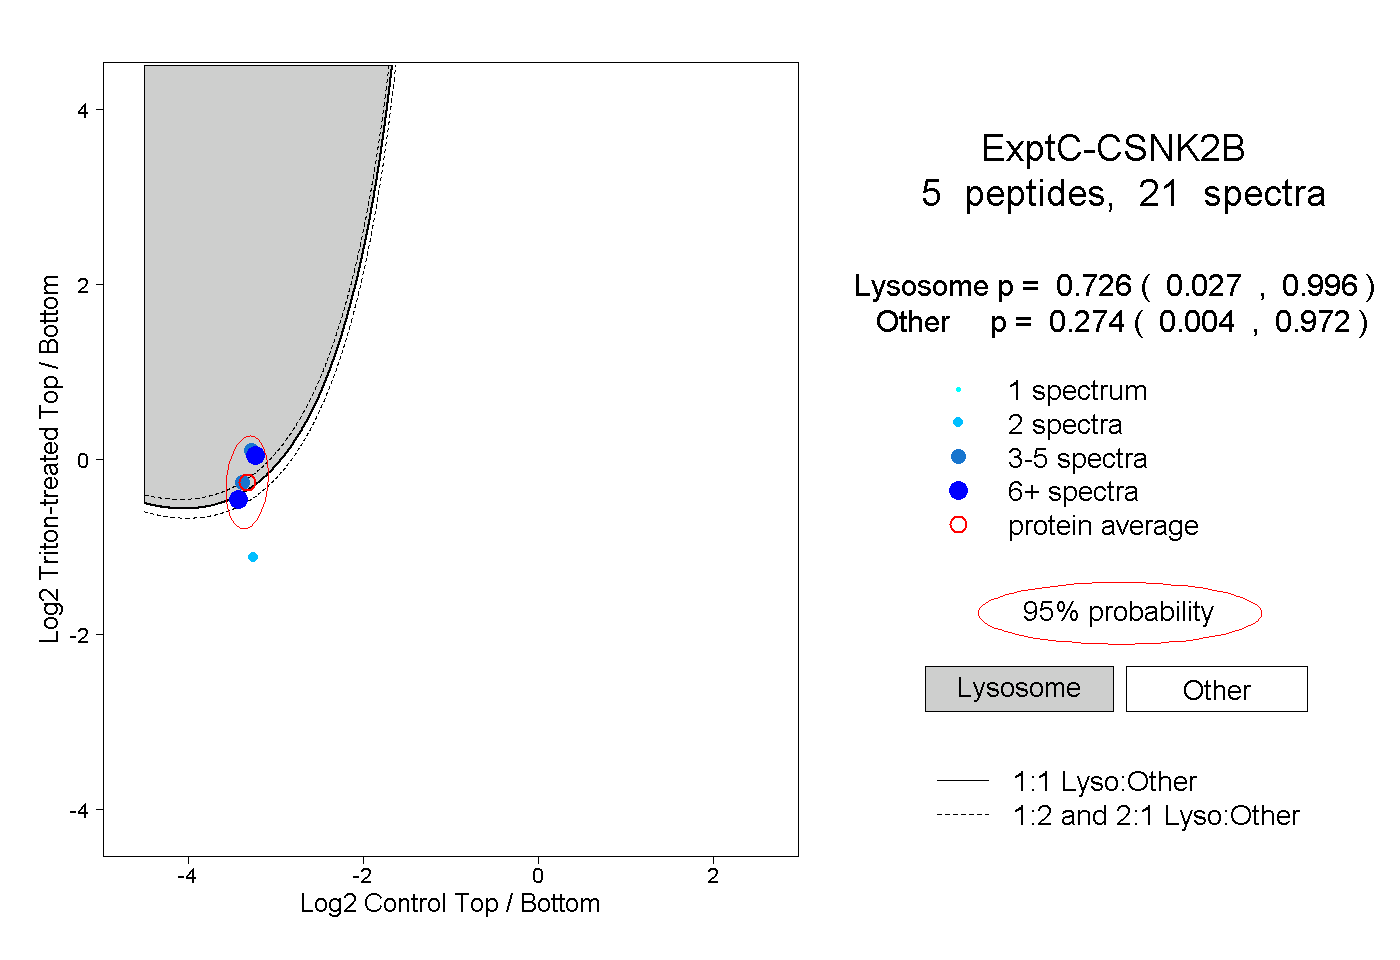
0.027 | 0.996
0.004 | 0.972