18
18peptides
spectra
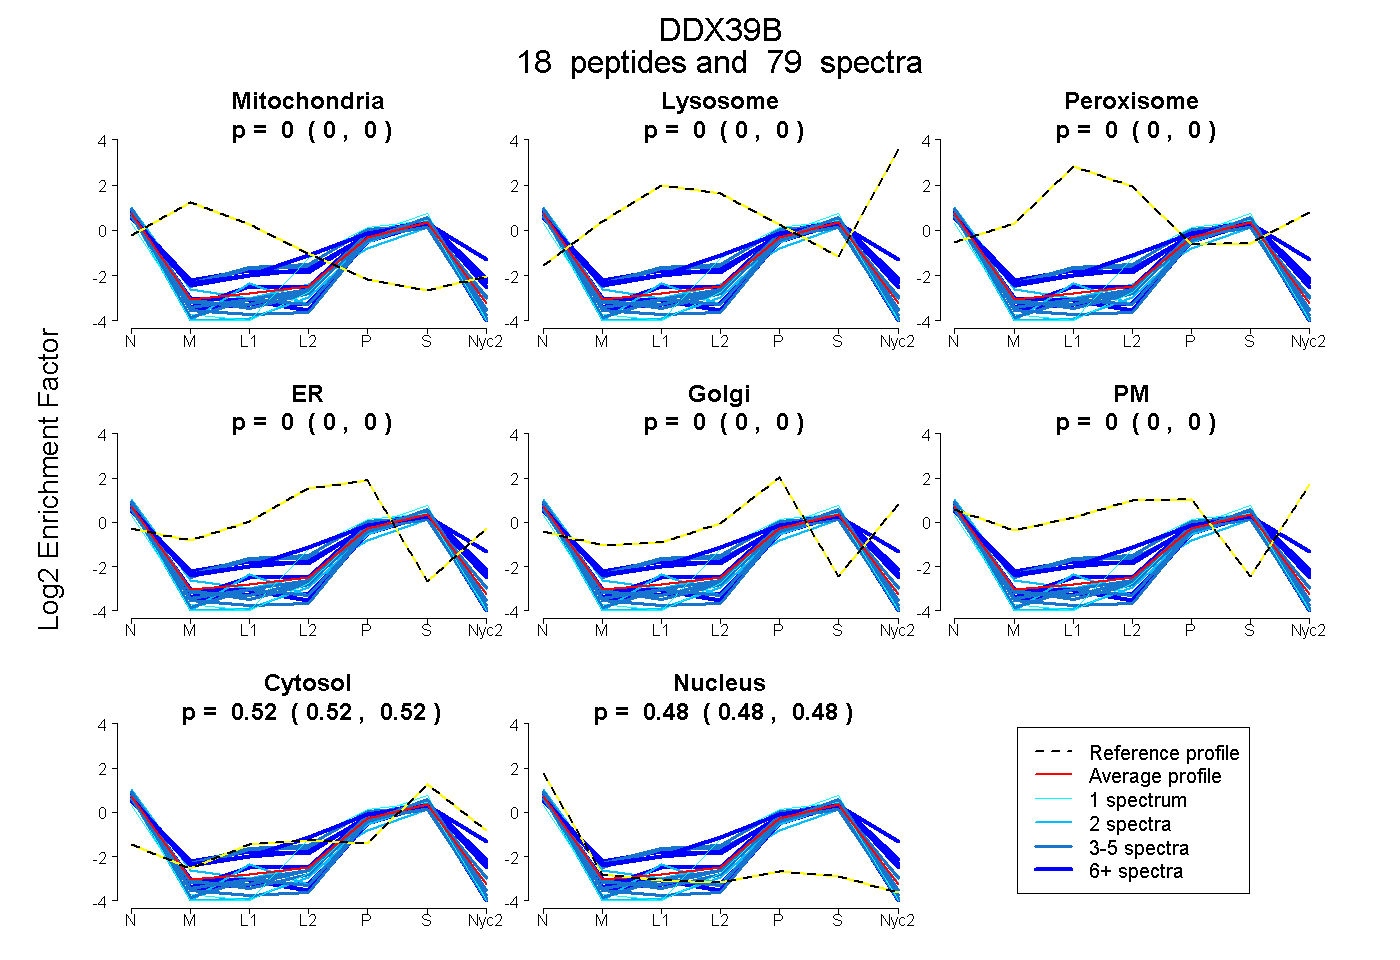
0.000 | 0.000
0.000 | 0.000
0.000 | 0.000
0.000 | 0.000
0.000 | 0.000
0.000 | 0.000
0.516 | 0.524
0.475 | 0.483
8peptides
spectra
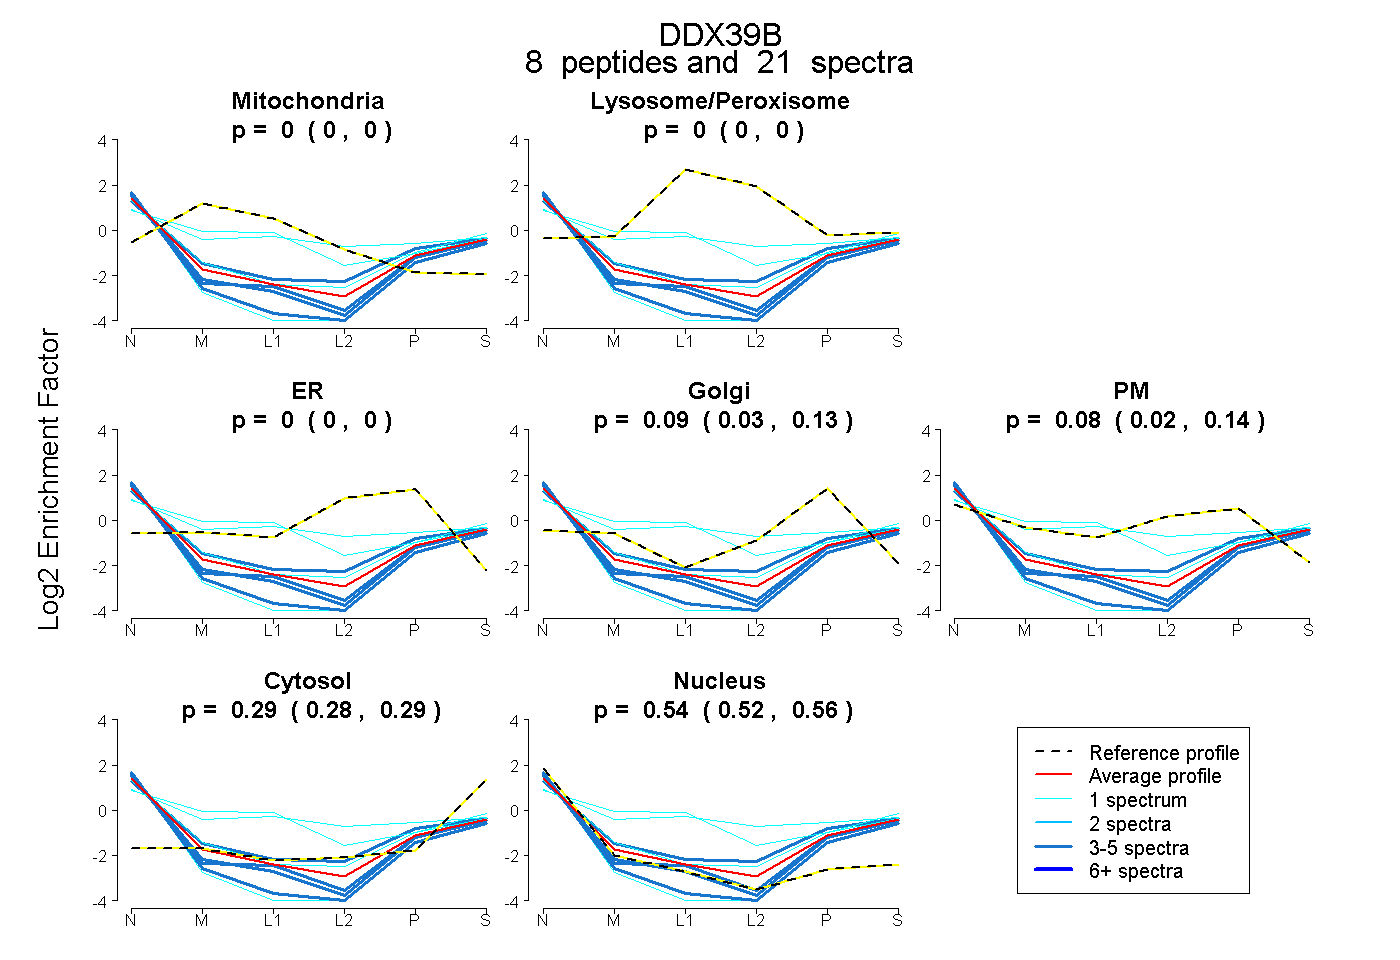
0.000 | 0.000
0.000 | 0.000
0.000 | 0.000
0.028 | 0.133
0.018 | 0.141
0.277 | 0.294
0.522 | 0.562