 5
5peptides
spectra
0.000 | 0.017
0.000 | 0.000
0.000 | 0.147
0.000 | 0.343
0.000 | 0.106
0.051 | 0.583
0.034 | 0.157
0.236 | 0.354
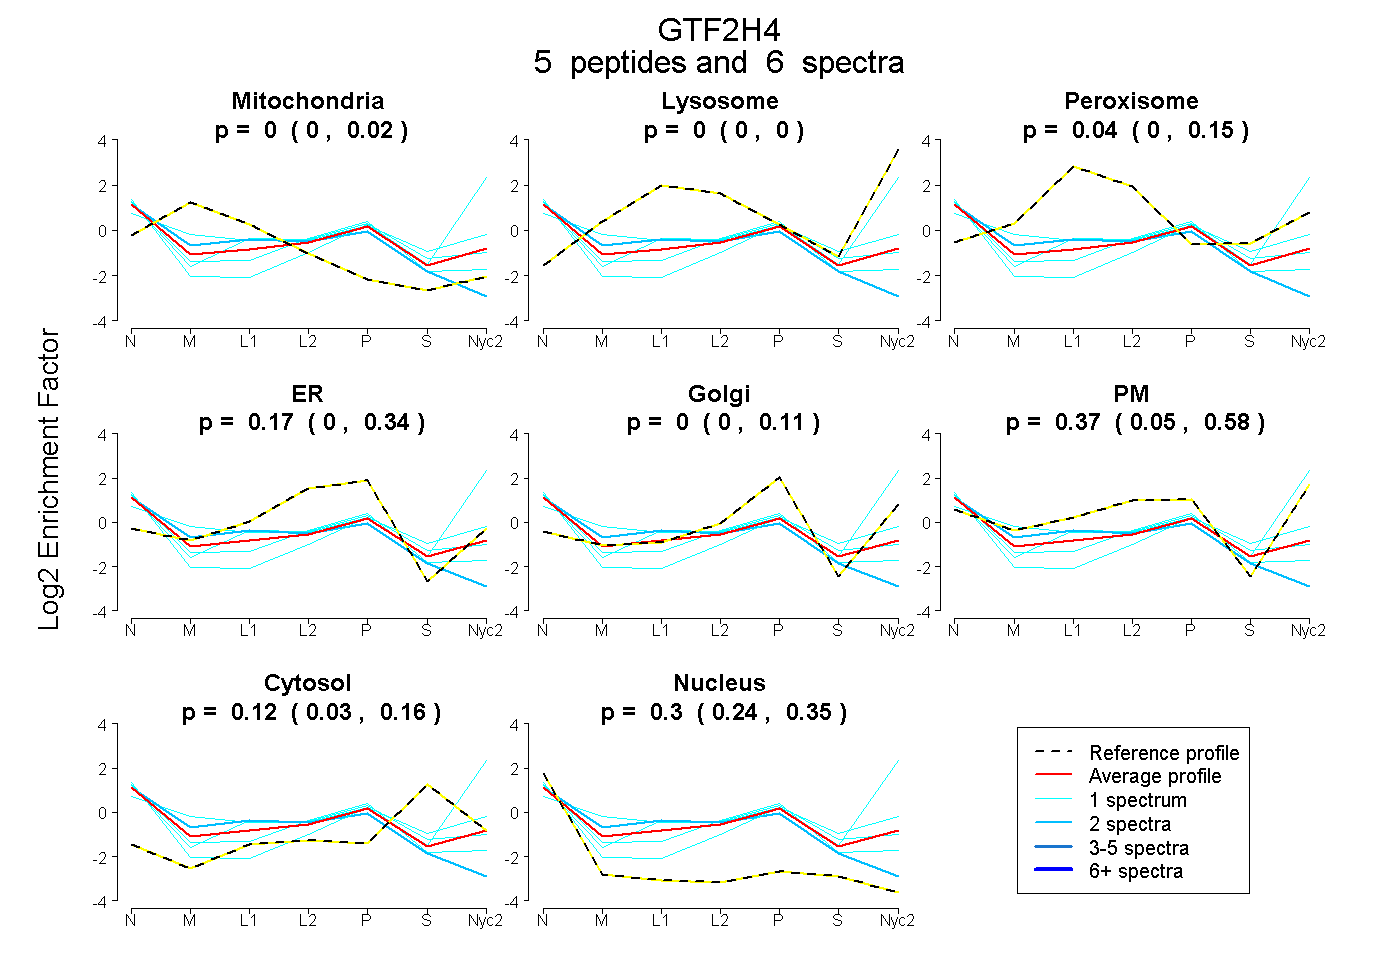
| Plot | Mito | Lyso | Perox | ER | Golgi | PM | Cytosol | Nucleus | |||||
| Expt A |
5 peptides |
6 spectra |
|
0.000 0.000 | 0.017 |
0.000 0.000 | 0.000 |
0.044 0.000 | 0.147 |
0.170 0.000 | 0.343 |
0.000 0.000 | 0.106 |
0.372 0.051 | 0.583 |
0.116 0.034 | 0.157 |
0.298 0.236 | 0.354 |
| 1 spectrum, IALLGGGK | 0.000 | 0.000 | 0.000 | 0.506 | 0.000 | 0.061 | 0.058 | 0.375 | ||
| 1 spectrum, FPNMVVAQVTR | 0.000 | 0.000 | 0.110 | 0.249 | 0.000 | 0.222 | 0.139 | 0.280 | ||
| 1 spectrum, NLQEFLGGLSPGVLDR | 0.000 | 0.000 | 0.000 | 0.000 | 0.157 | 0.524 | 0.162 | 0.158 | ||
| 1 spectrum, AHPVMLK | 0.191 | 0.000 | 0.000 | 0.000 | 0.032 | 0.490 | 0.232 | 0.056 | ||
| 2 spectra, LYGHPATCLAVFR | 0.205 | 0.000 | 0.071 | 0.378 | 0.000 | 0.000 | 0.000 | 0.346 |