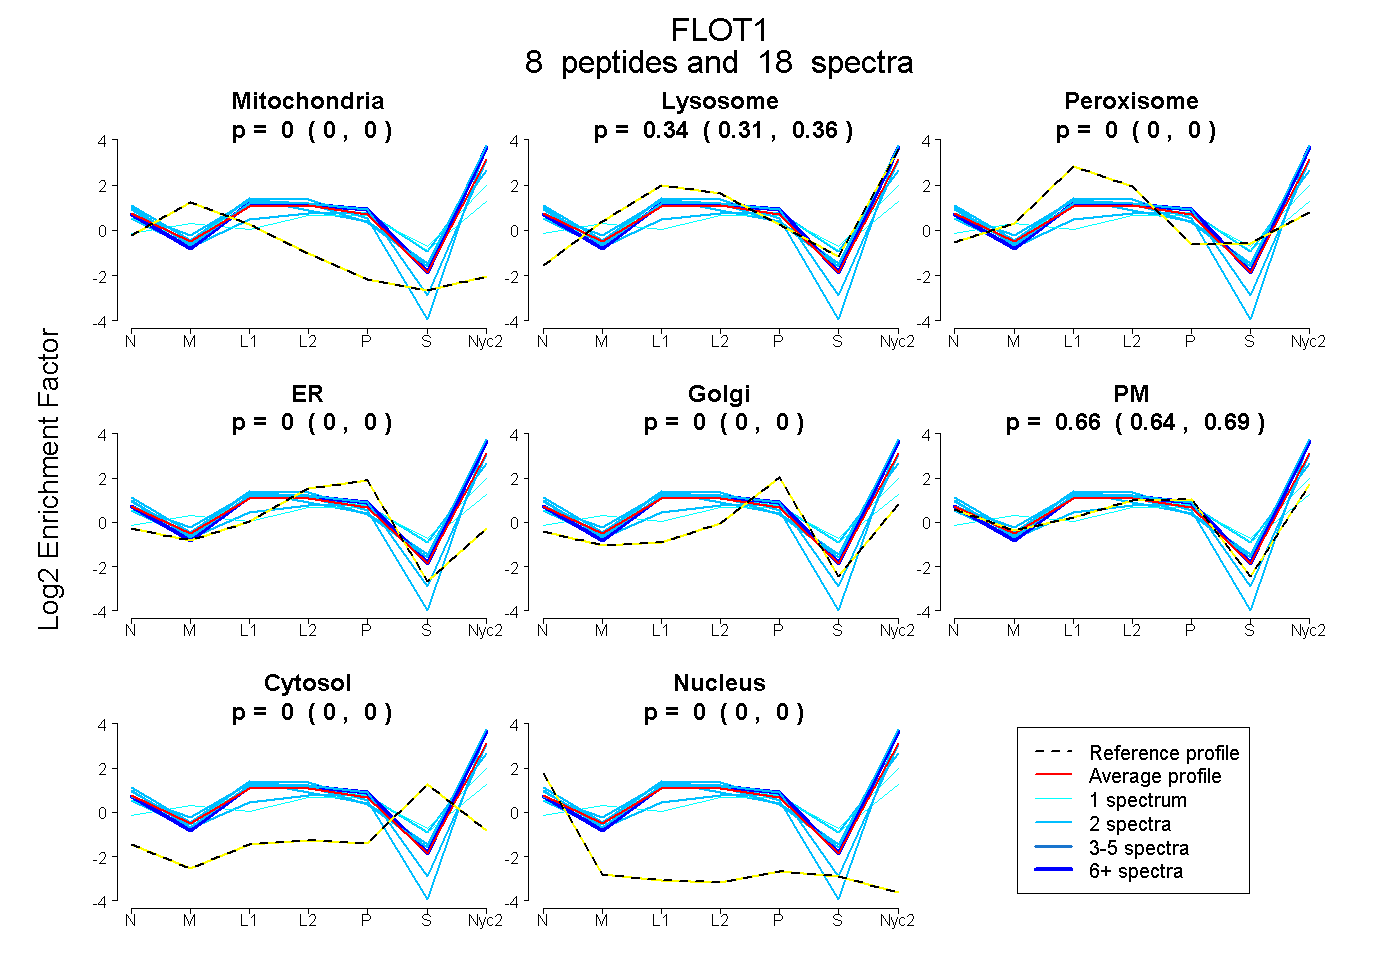
 8
8peptides
spectra
0.000 | 0.000
0.309 | 0.356
0.000 | 0.000
0.000 | 0.000
0.000 | 0.000
0.641 | 0.686
0.000 | 0.000
0.000 | 0.000
| Plot | Mito | Lyso | Perox | ER | Golgi | PM | Cytosol | Nucleus | |||||
| Expt A |
8 peptides |
18 spectra |
|
0.000 0.000 | 0.000 |
0.335 0.309 | 0.356 |
0.000 0.000 | 0.000 |
0.000 0.000 | 0.000 |
0.000 0.000 | 0.000 |
0.665 0.641 | 0.686 |
0.000 0.000 | 0.000 |
0.000 0.000 | 0.000 |
| 6 spectra, SPPVMVAGGR | 0.000 | 0.397 | 0.000 | 0.000 | 0.000 | 0.603 | 0.000 | 0.000 | ||
| 2 spectra, LPESVER | 0.000 | 0.233 | 0.000 | 0.000 | 0.000 | 0.767 | 0.000 | 0.000 | ||
| 2 spectra, VTGEVLDILSR | 0.000 | 0.434 | 0.000 | 0.000 | 0.000 | 0.566 | 0.000 | 0.000 | ||
| 2 spectra, VSAQCLSEIEMAK | 0.000 | 0.273 | 0.000 | 0.000 | 0.000 | 0.727 | 0.000 | 0.000 | ||
| 1 spectrum, EMLAAACQMFLGK | 0.000 | 0.000 | 0.359 | 0.000 | 0.000 | 0.564 | 0.076 | 0.000 | ||
| 2 spectra, ATYDIEVNTR | 0.000 | 0.455 | 0.000 | 0.000 | 0.000 | 0.545 | 0.000 | 0.000 | ||
| 1 spectrum, FSEQVFK | 0.000 | 0.317 | 0.000 | 0.000 | 0.000 | 0.505 | 0.177 | 0.000 | ||
| 2 spectra, AQLIMQAEAEAESVR | 0.000 | 0.286 | 0.000 | 0.000 | 0.000 | 0.601 | 0.113 | 0.000 |
| Plot | Lyso | Other | |||||||||||
| Expt C |
4 peptides |
4 spectra |
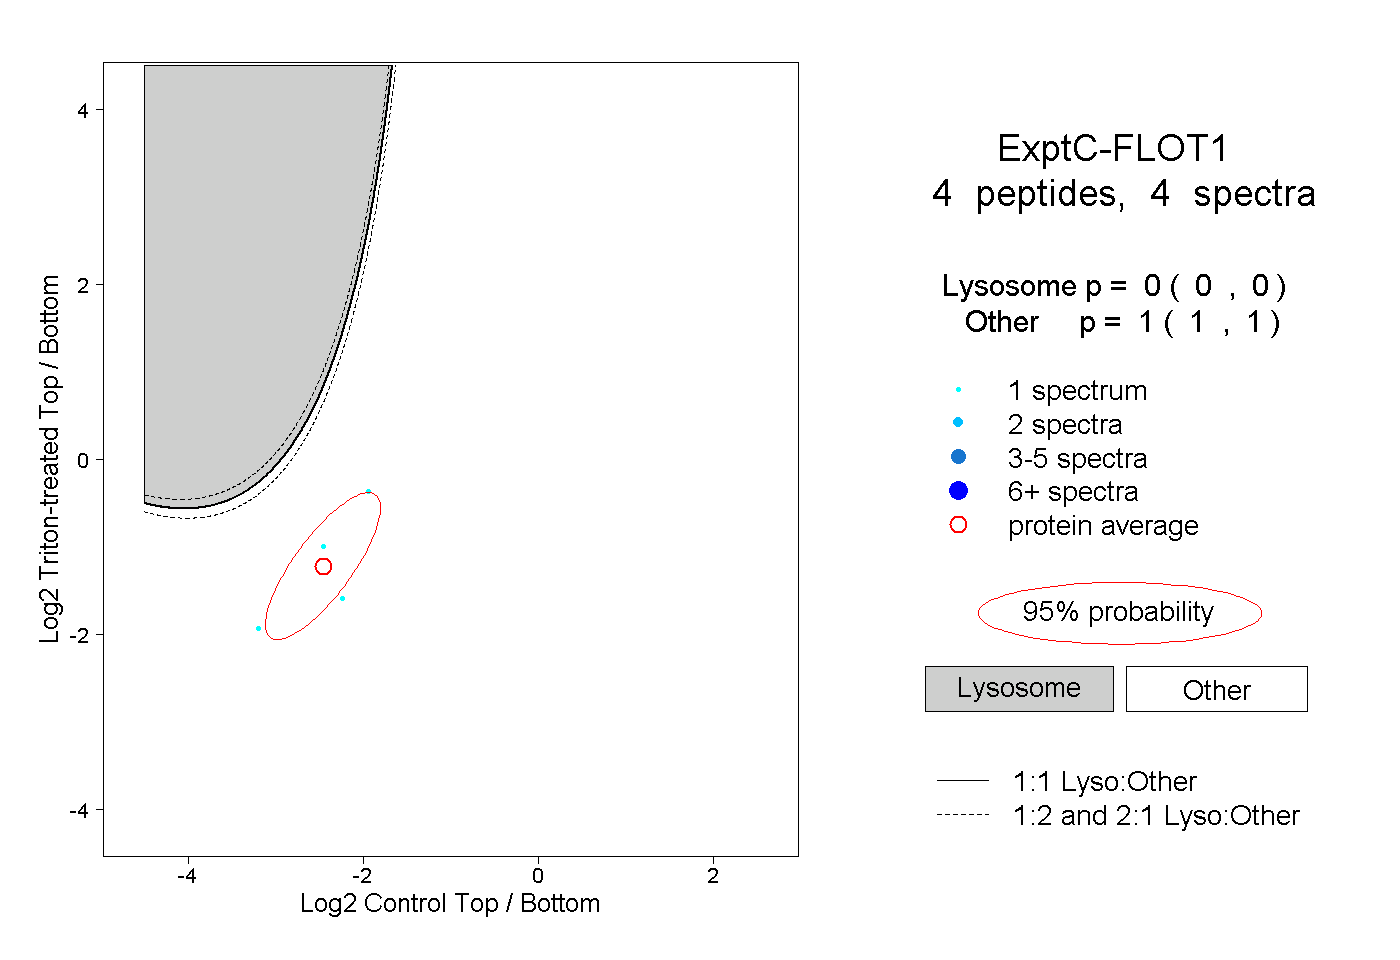 |
0.000 0.000 | 0.000 |
1.000 1.000 | 1.000 |
||||||||
| Plot | Lyso | Other | |||||||||||
| Expt D |
1 peptide |
1 spectrum |
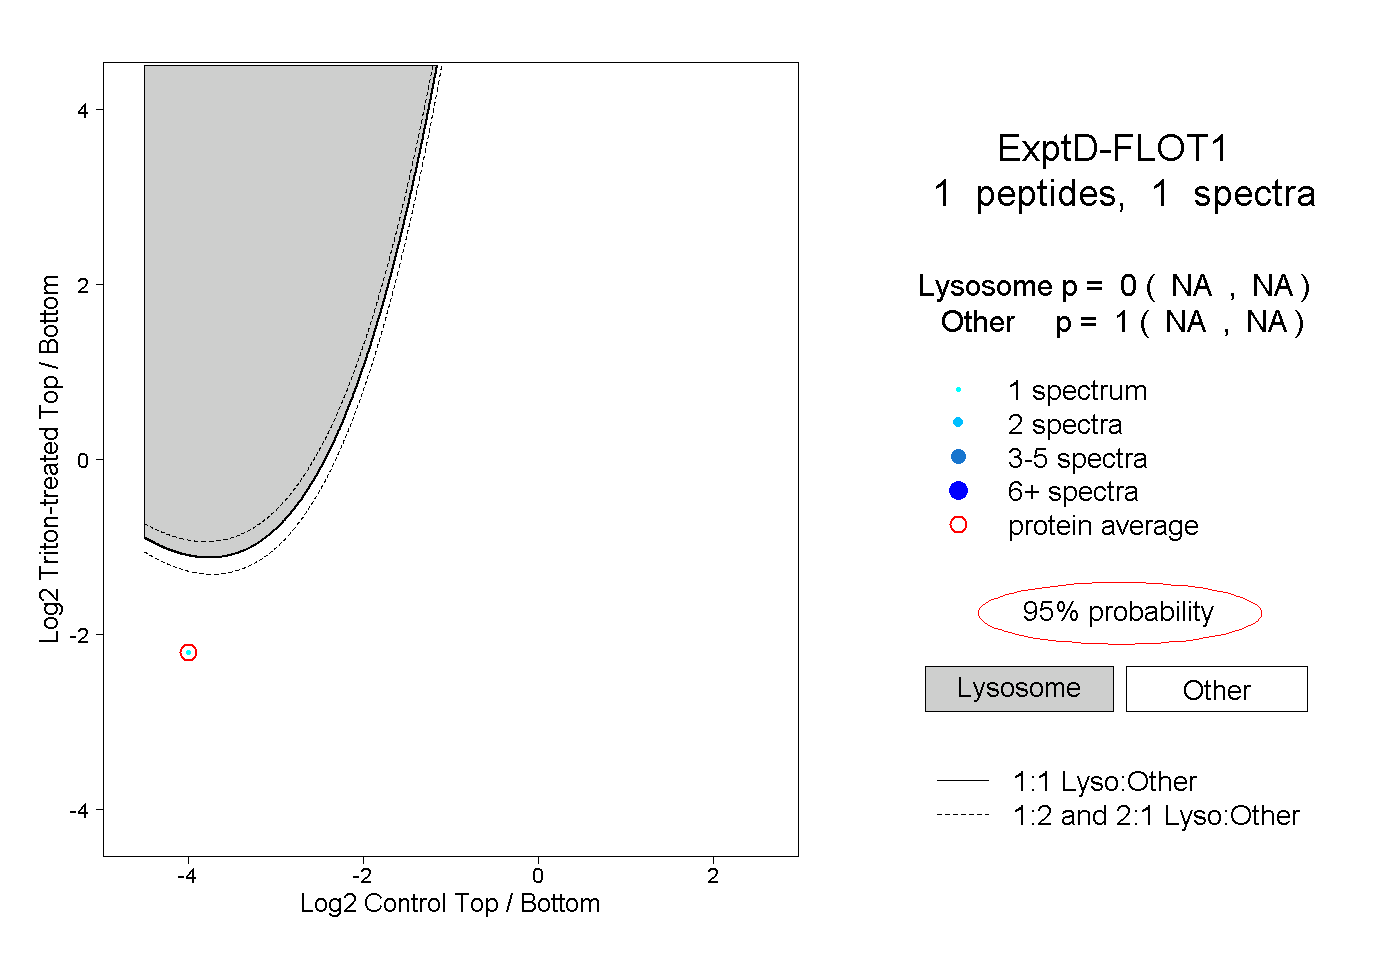 |
0.000 NA | NA |
1.000 NA | NA |