 4
4peptides
spectra
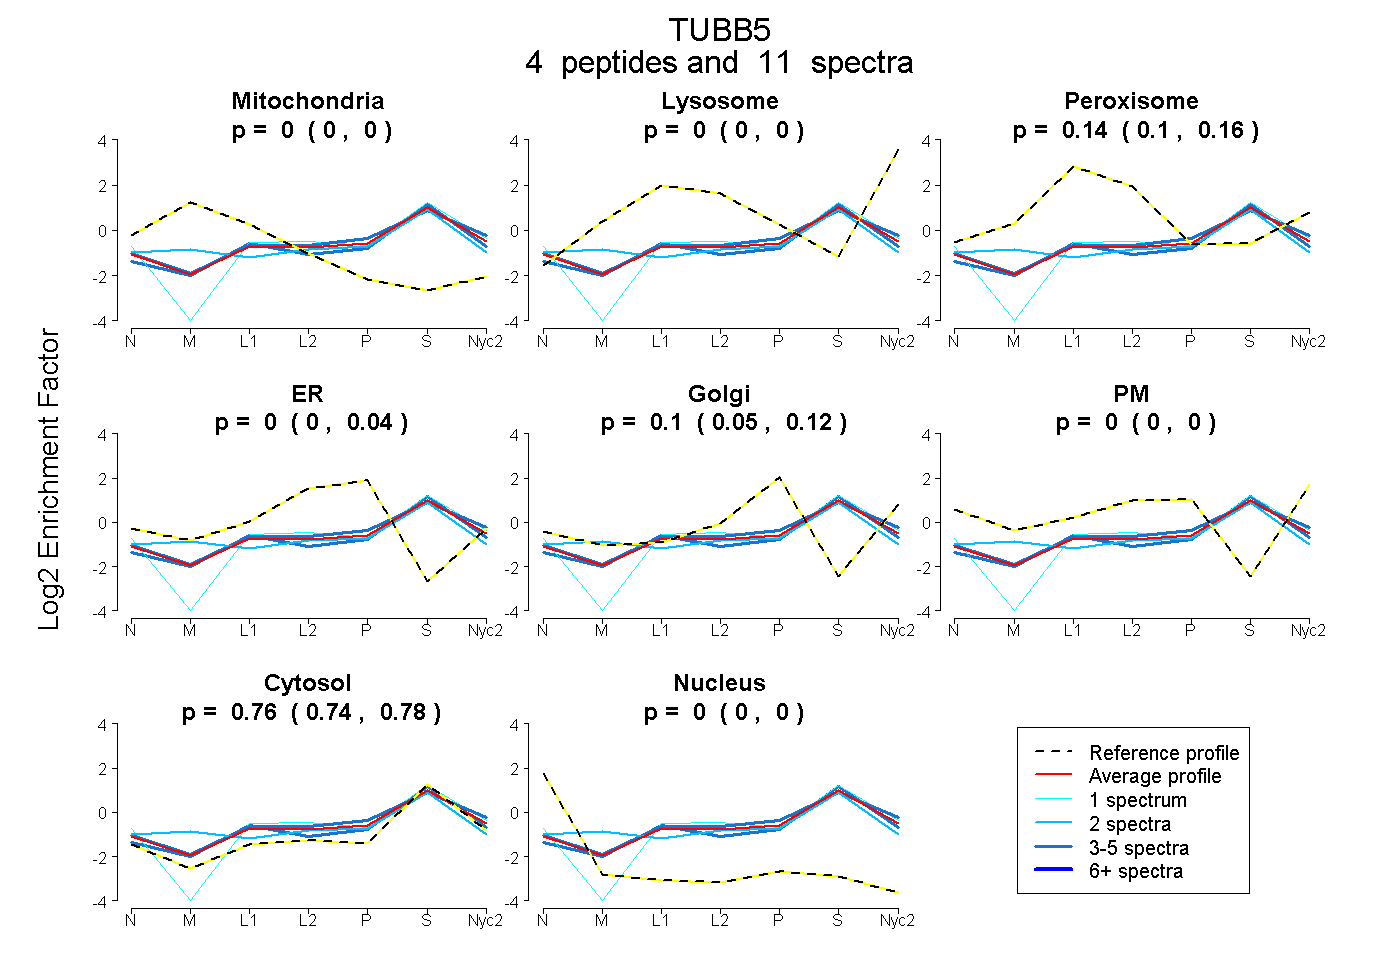
0.000 | 0.000
0.000 | 0.001
0.102 | 0.158
0.000 | 0.038
0.054 | 0.120
0.000 | 0.000
0.739 | 0.784
0.000 | 0.000
3peptides
spectra
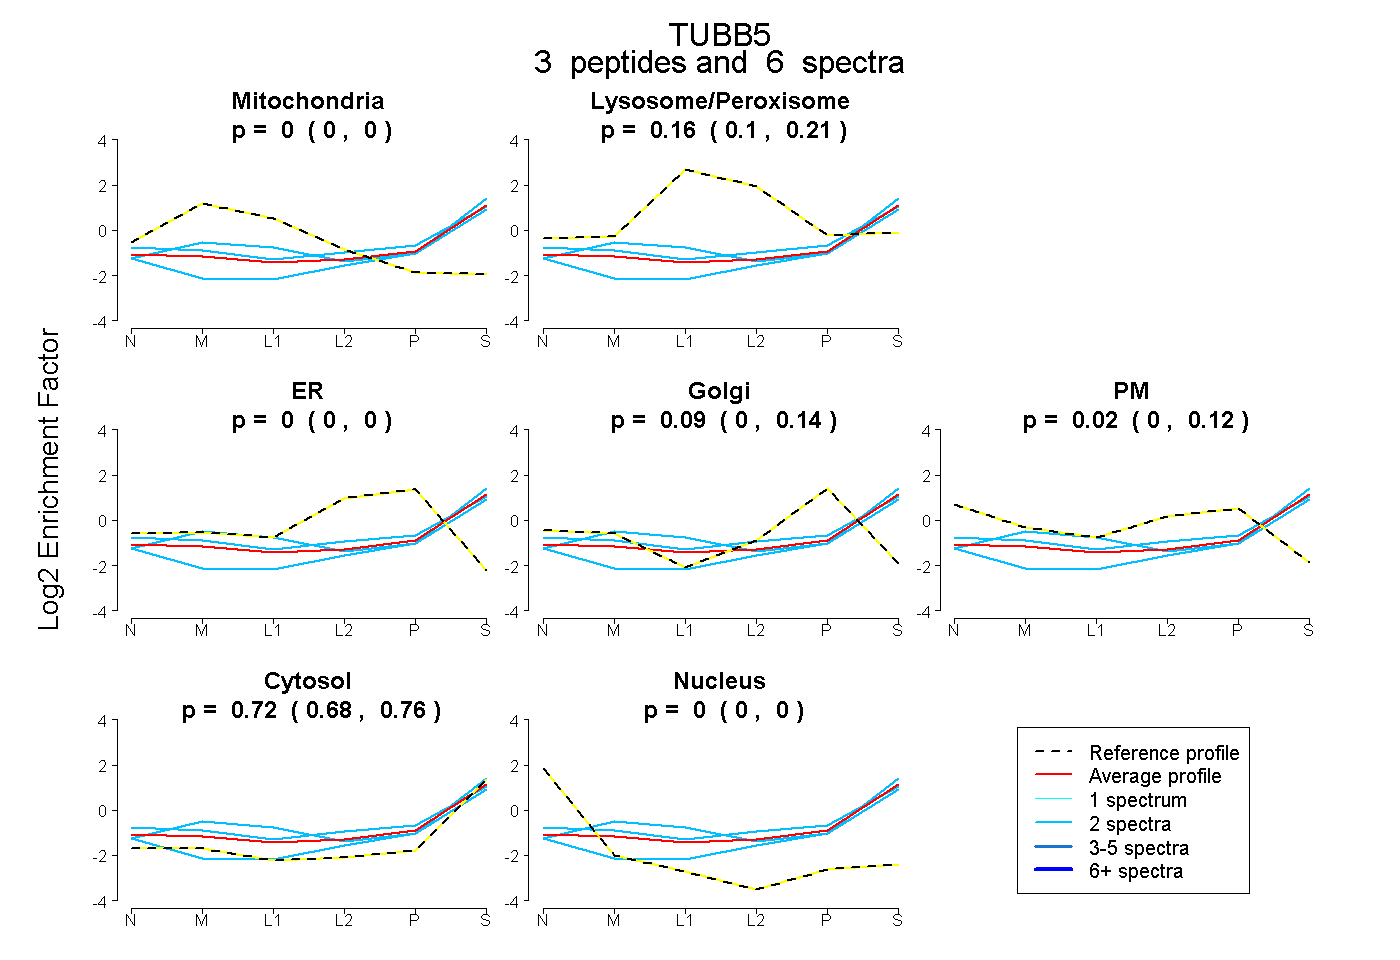
0.000 | 0.000
0.098 | 0.206
0.000 | 0.000
0.000 | 0.141
0.000 | 0.118
0.683 | 0.756
0.000 | 0.000
3peptides
spectra
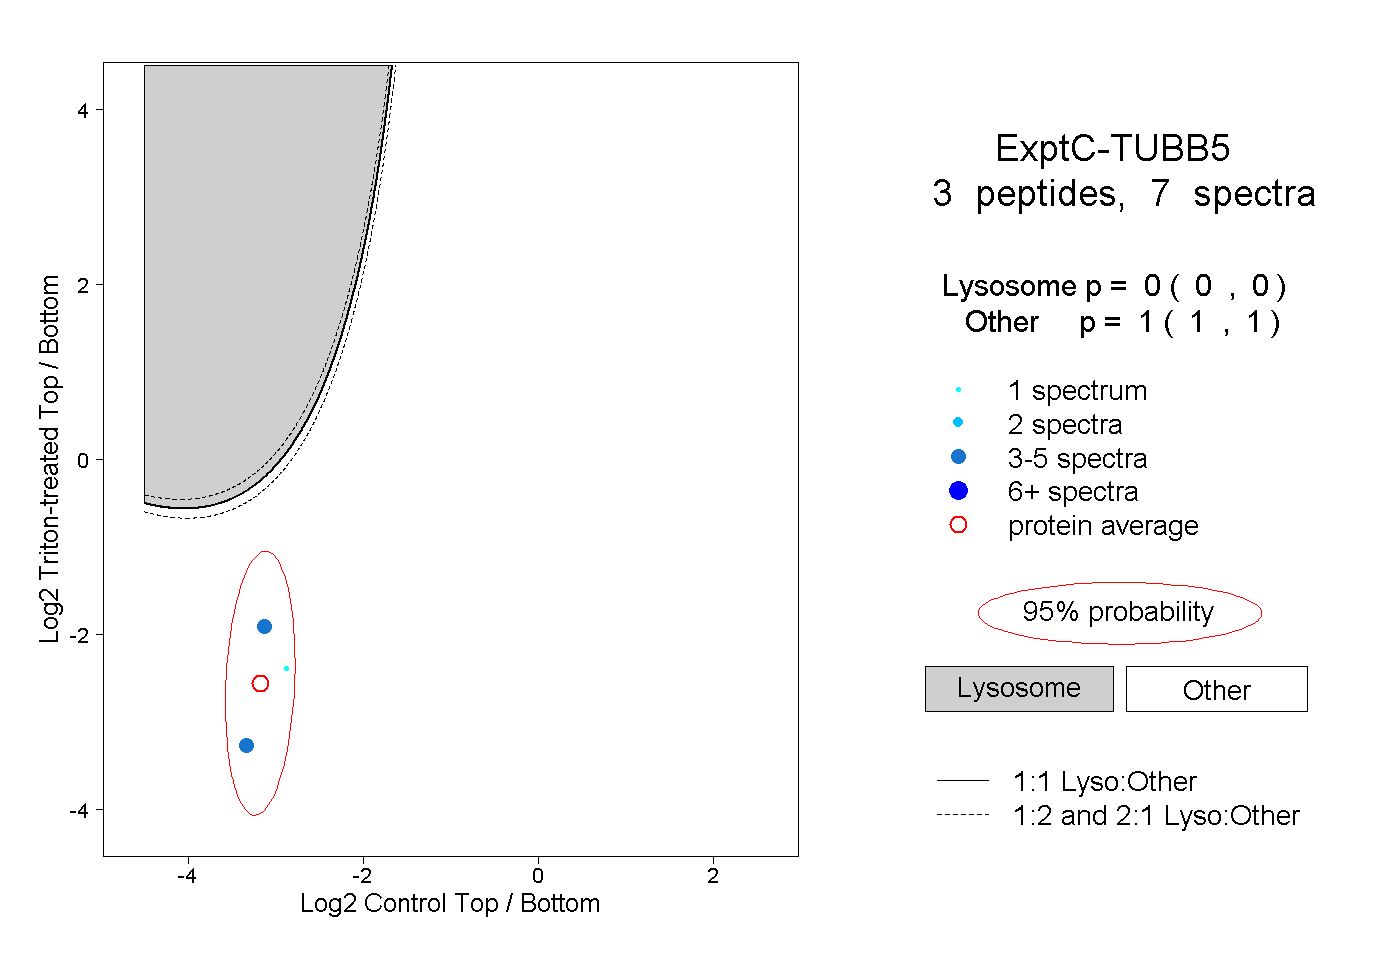
0.000 | 0.000
1.000 | 1.000