 3
3peptides
spectra
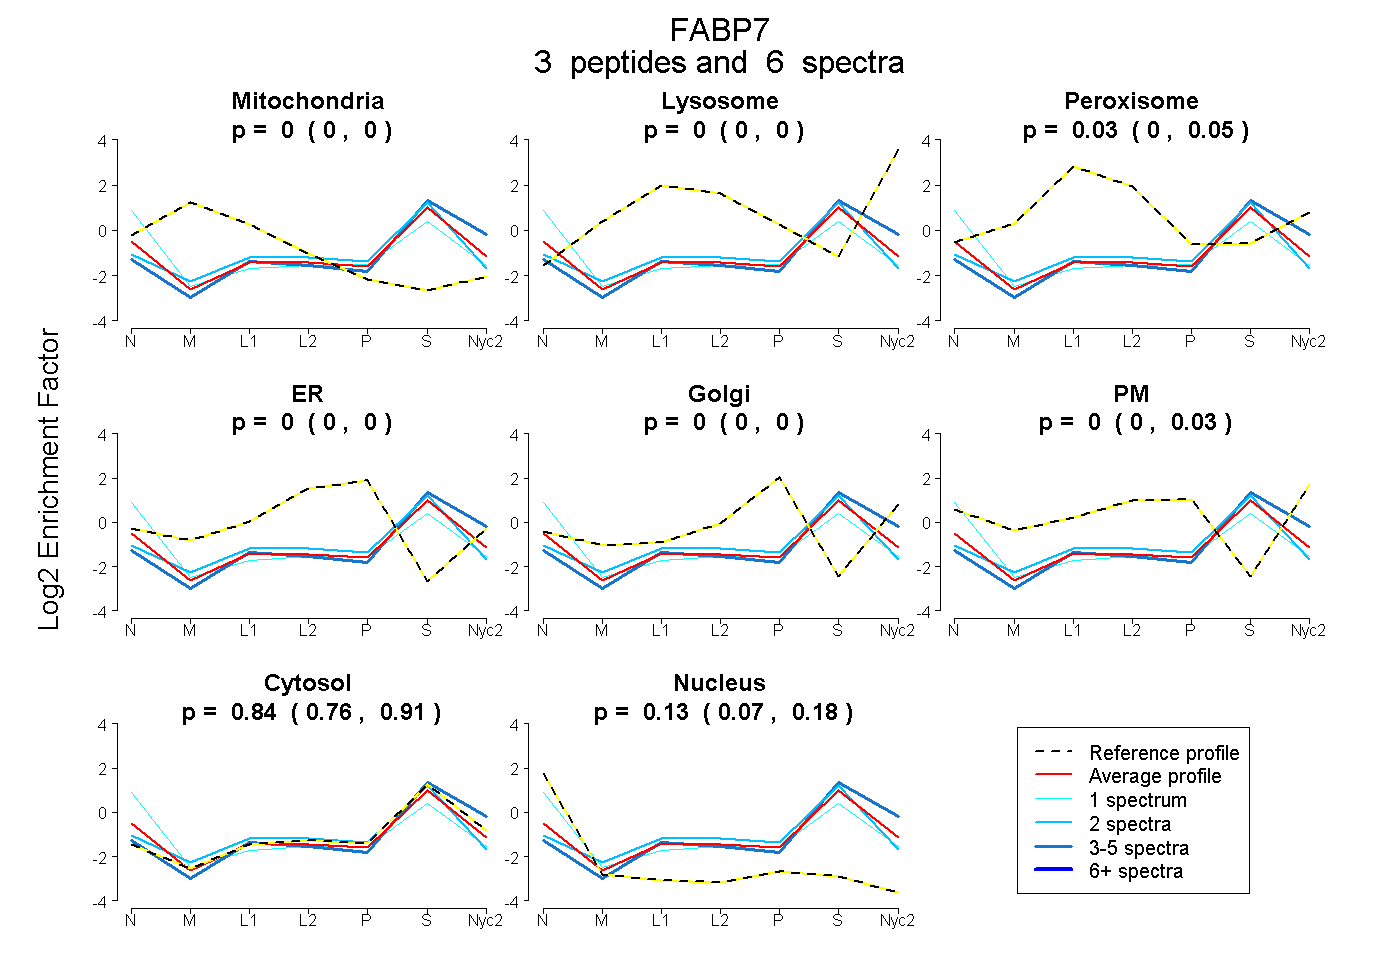
0.000 | 0.000
0.000 | 0.000
0.000 | 0.050
0.000 | 0.000
0.000 | 0.000
0.000 | 0.025
0.762 | 0.905
0.073 | 0.177
2peptides
spectra
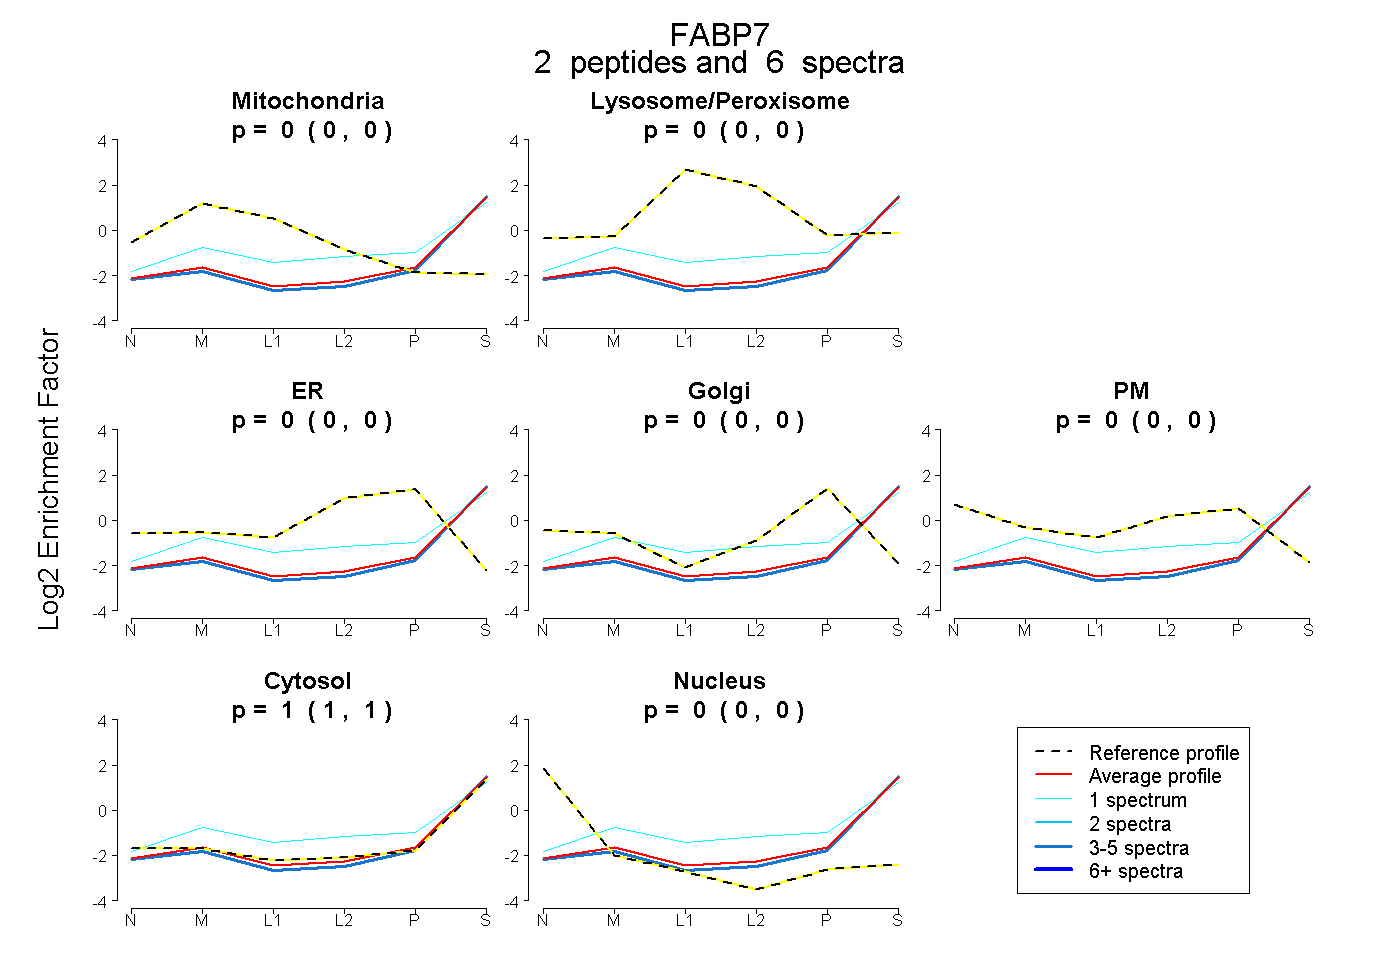
0.000 | 0.000
0.000 | 0.000
0.000 | 0.000
0.000 | 0.000
0.000 | 0.000
1.000 | 1.000
0.000 | 0.000
5peptides
spectra
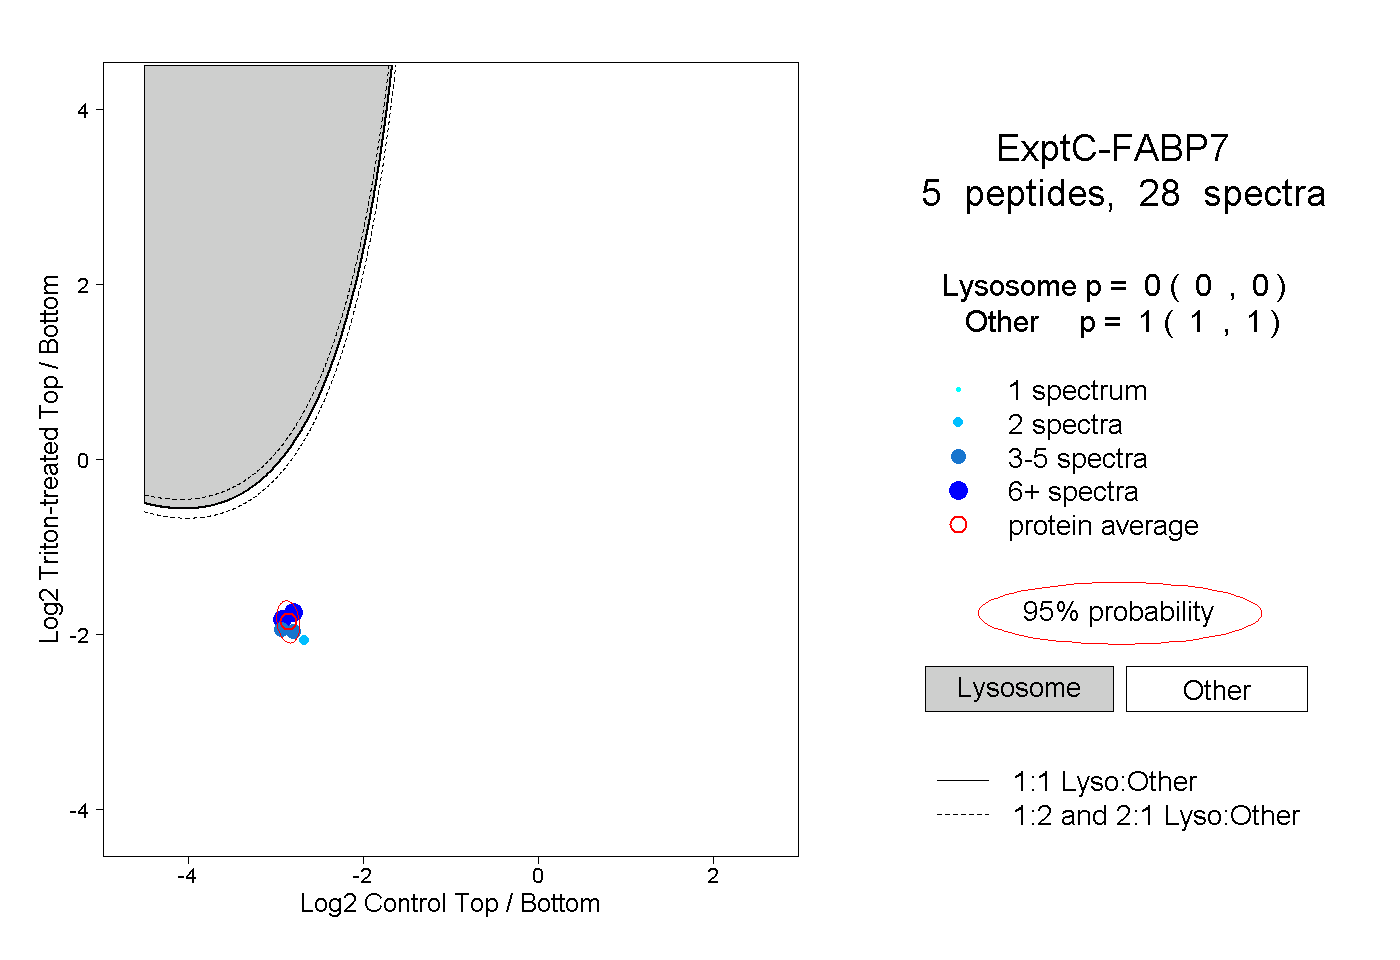
0.000 | 0.000
1.000 | 1.000
1peptide
spectra
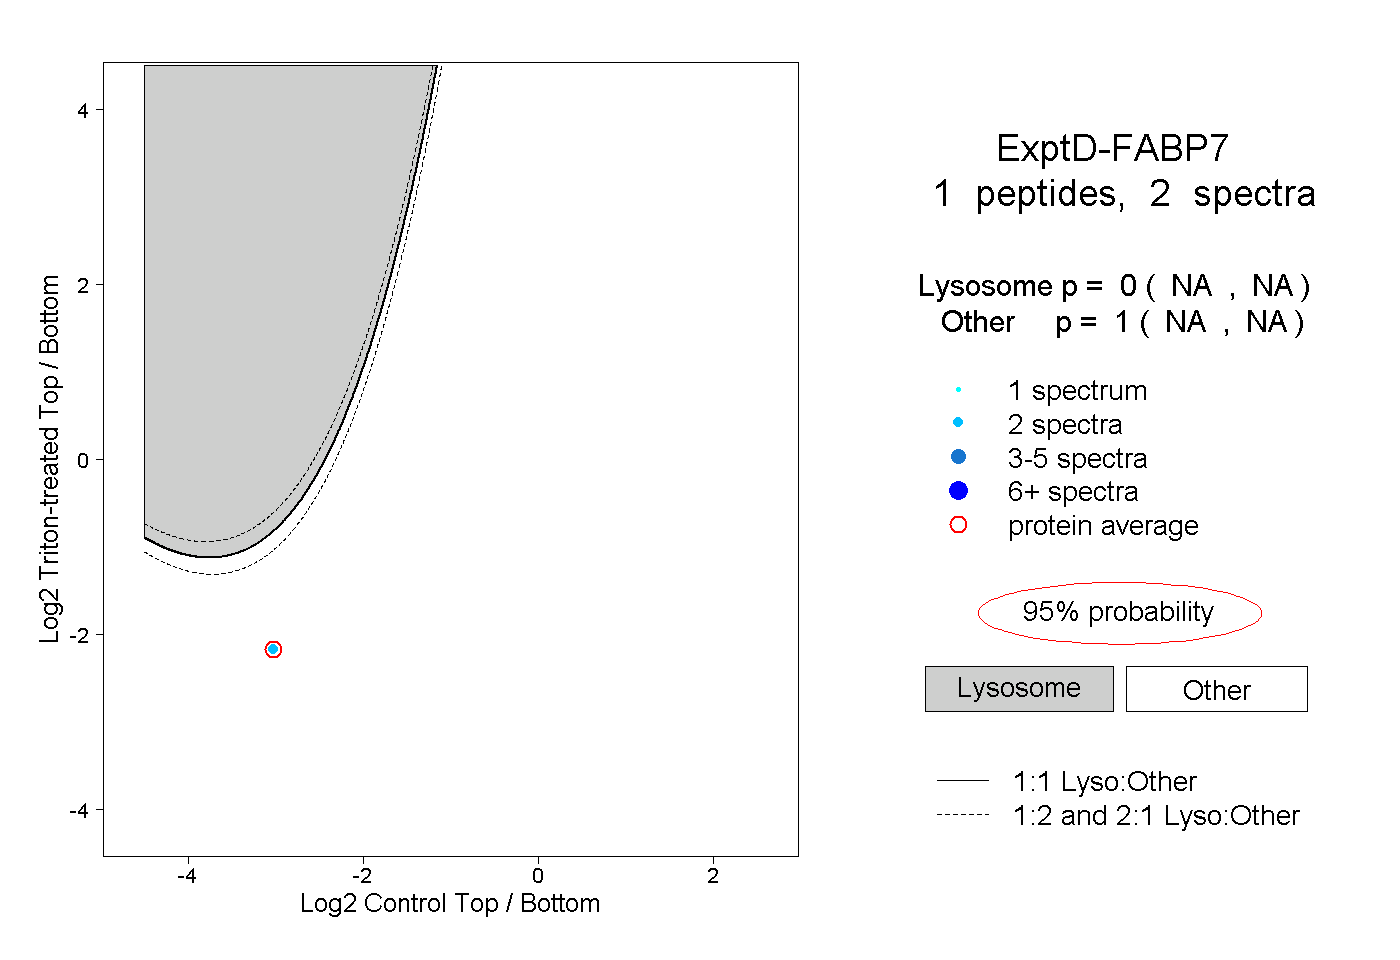
NA | NA
NA | NA