 3
3peptides
spectra
0.433 | 0.609
0.199 | 0.440
0.000 | 0.133
0.000 | 0.000
0.000 | 0.000
0.000 | 0.192
0.000 | 0.045
0.000 | 0.059
5peptides
spectra
0.000 | 0.000
1.000 | 1.000
| Plot | Mito | Lyso | Perox | ER | Golgi | PM | Cytosol | Nucleus | |||||
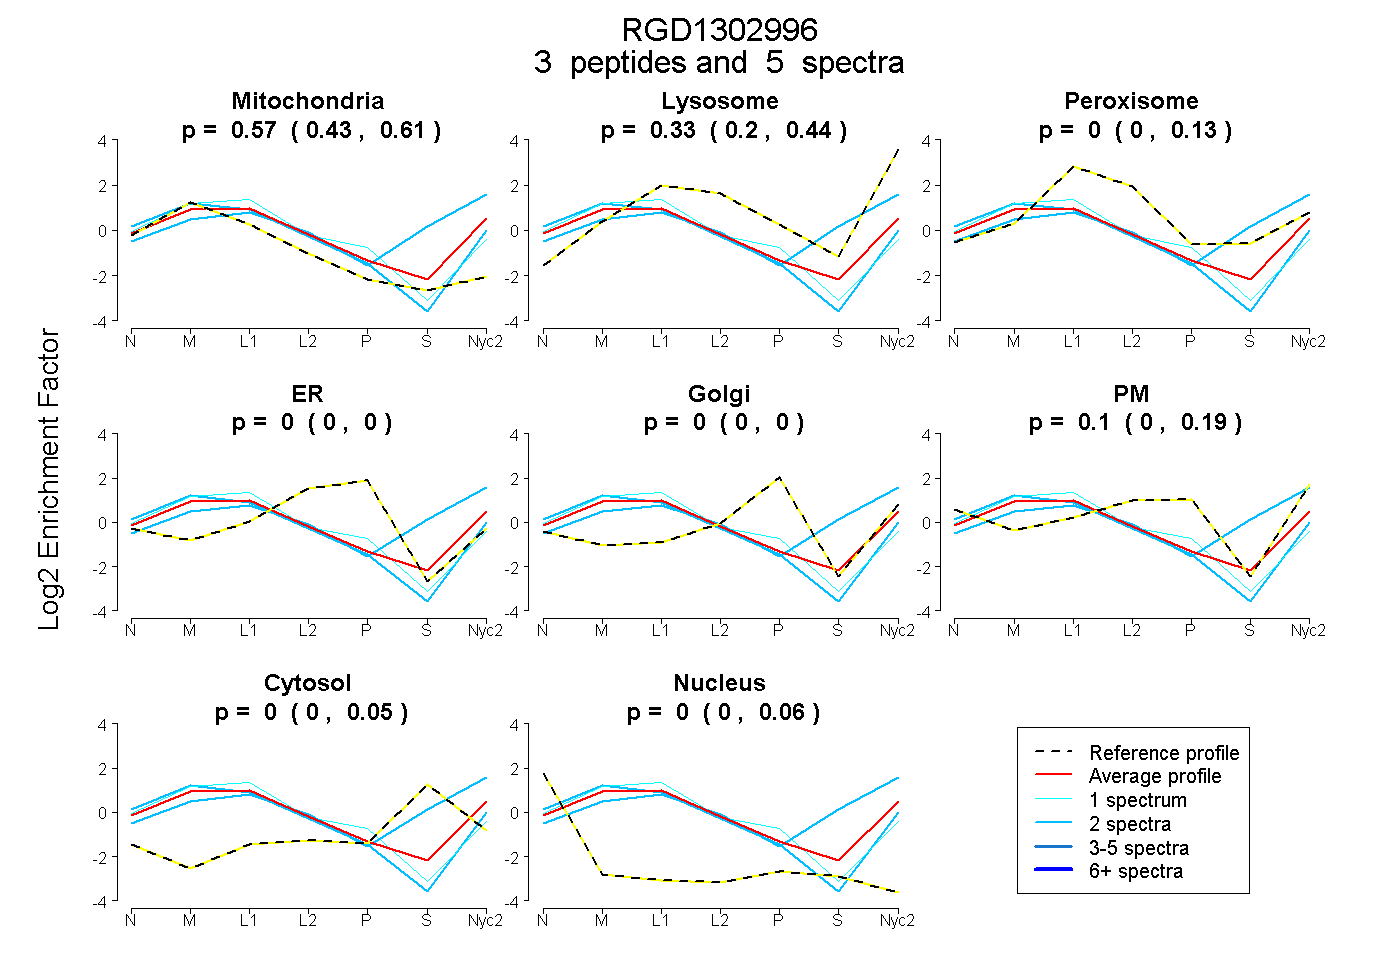
| Expt A |
3 peptides |
5 spectra |
|
0.570 0.433 | 0.609 |
0.332 0.199 | 0.440 |
0.000 0.000 | 0.133 |
0.000 0.000 | 0.000 |
0.000 0.000 | 0.000 |
0.096 0.000 | 0.192 |
0.000 0.000 | 0.045 |
0.001 0.000 | 0.059 |
||
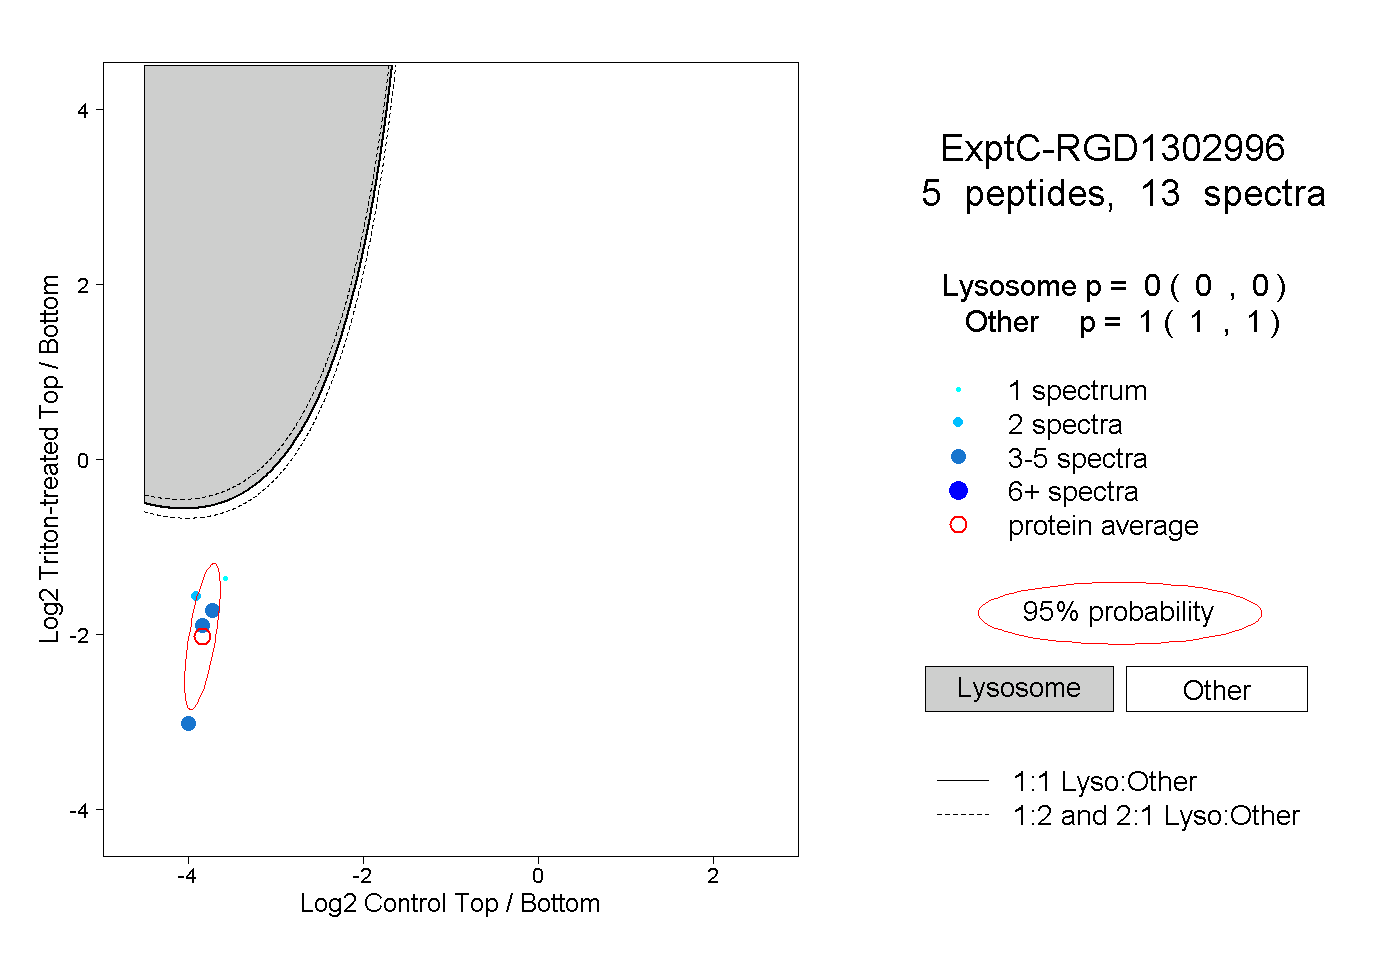
| Plot | Lyso | Other | |||||||||||
| Expt C |
5 peptides |
13 spectra |
|
0.000 0.000 | 0.000 |
1.000 1.000 | 1.000 |