 3
3peptides
spectra
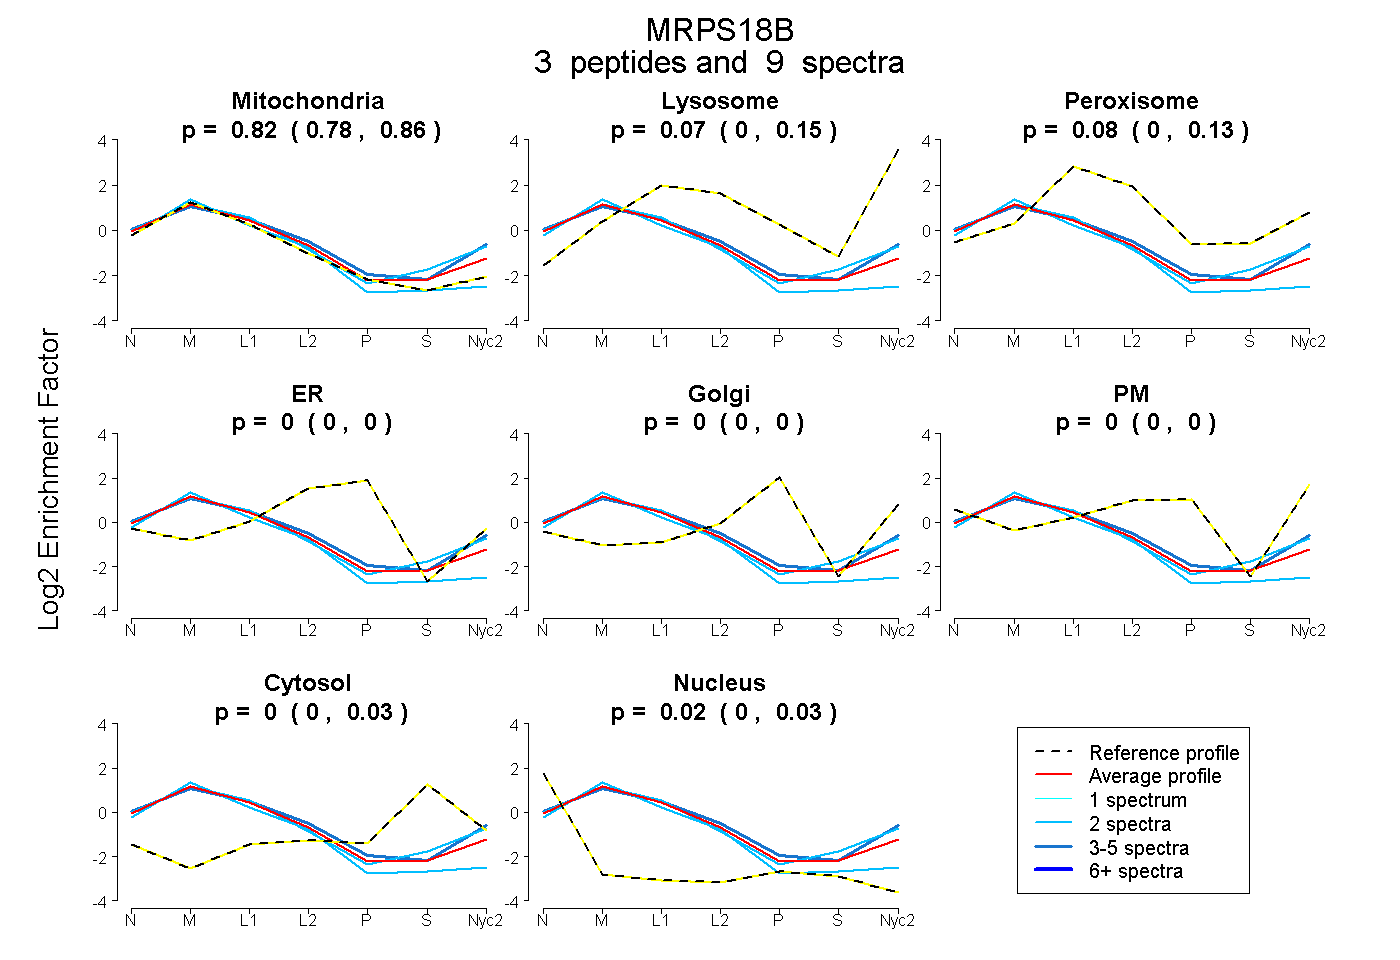
0.781 | 0.858
0.000 | 0.154
0.000 | 0.130
0.000 | 0.000
0.000 | 0.000
0.000 | 0.002
0.000 | 0.032
0.000 | 0.034
1peptide
spectrum
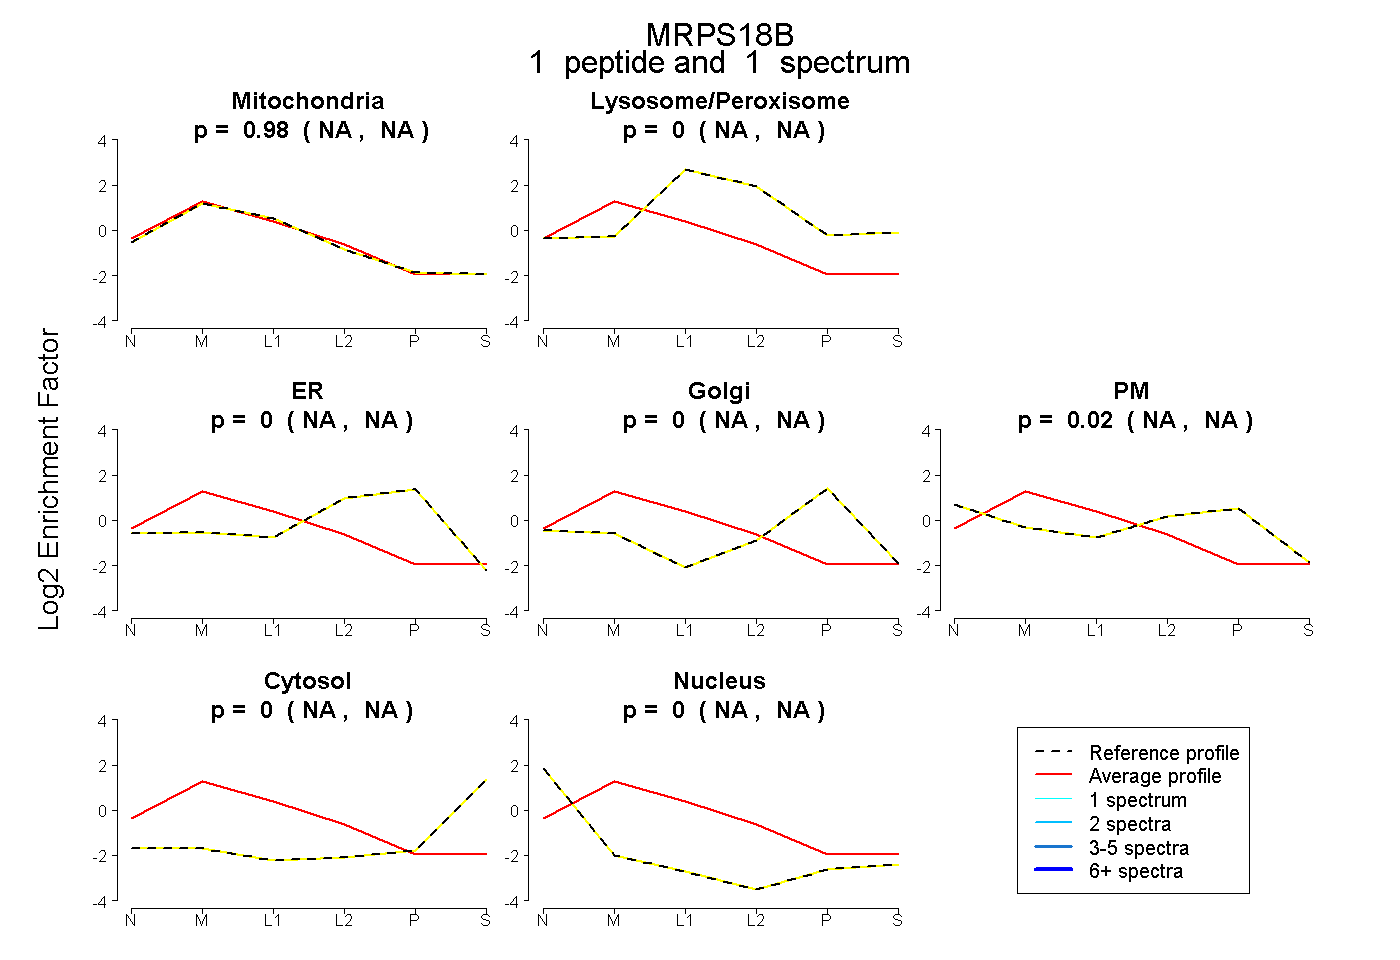
NA | NA
NA | NA
NA | NA
NA | NA
NA | NA
NA | NA
NA | NA
4peptides
spectra
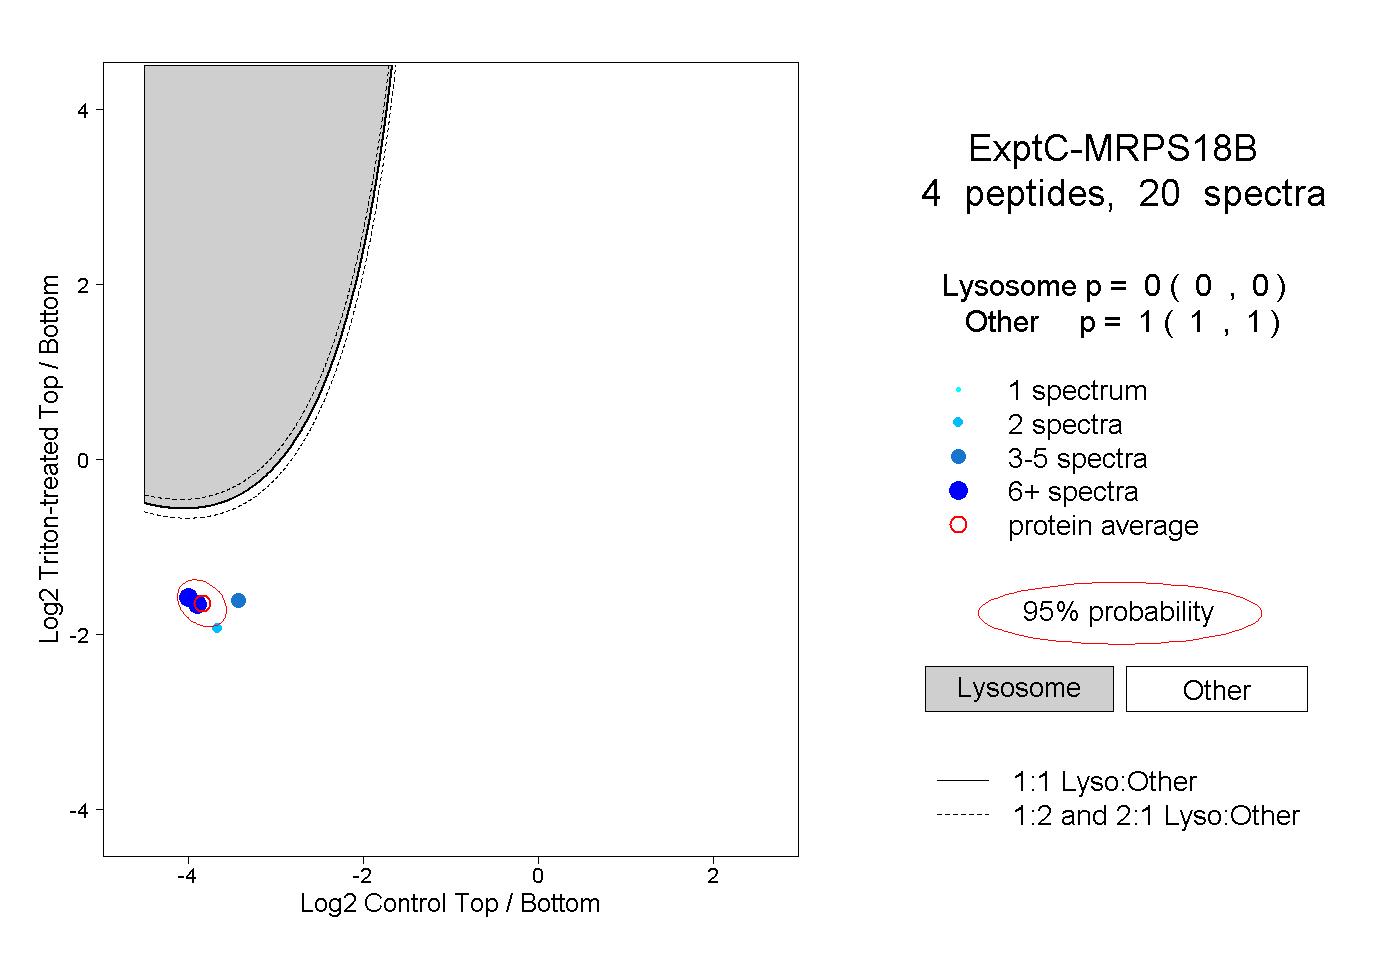
0.000 | 0.000
1.000 | 1.000
2peptides
spectra
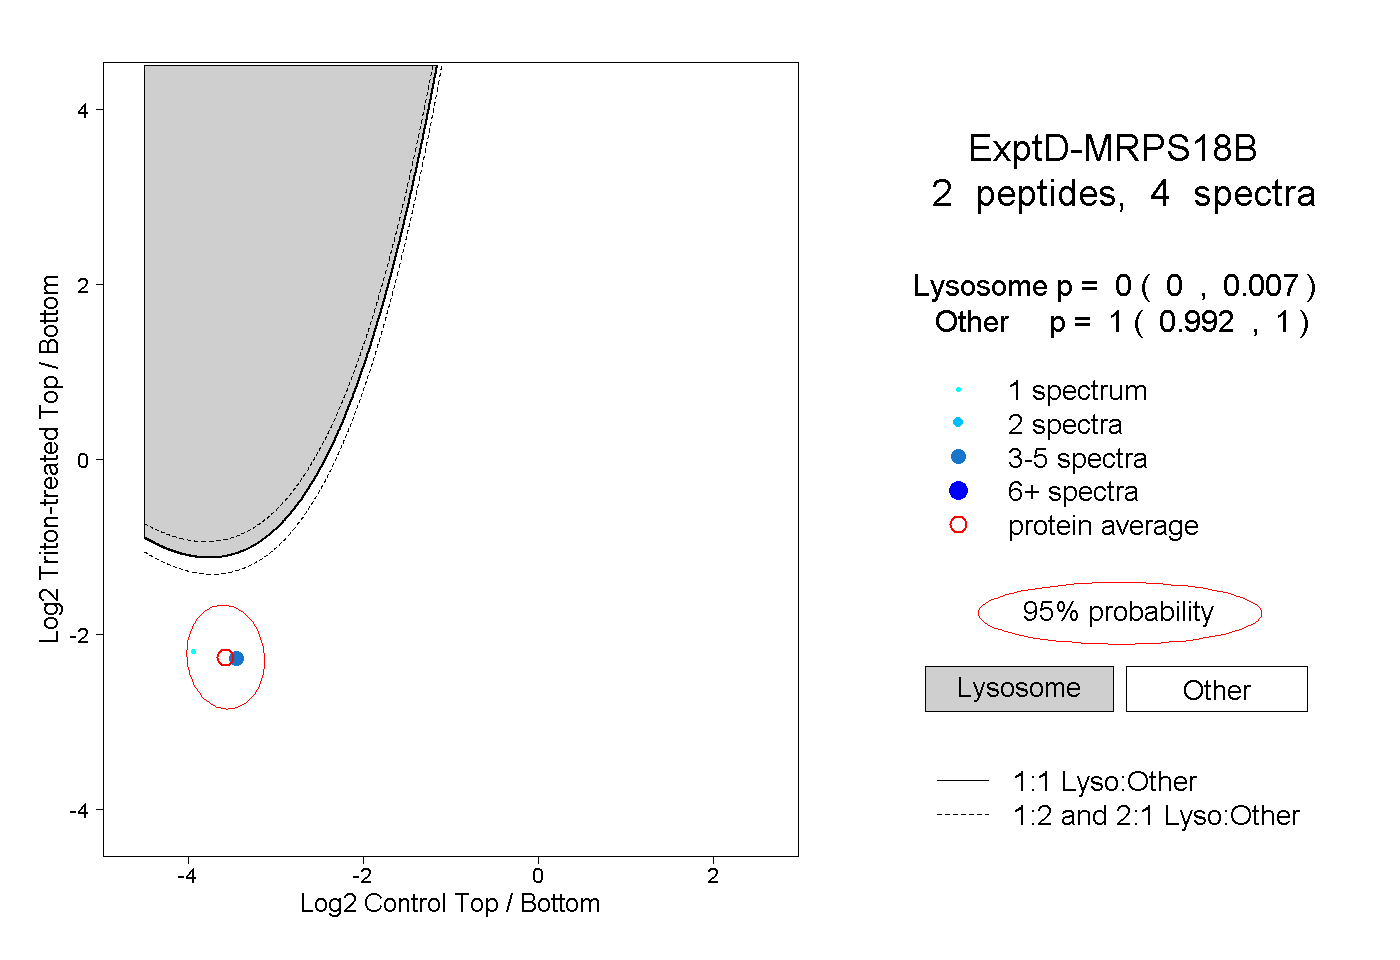
0.000 | 0.007
0.992 | 1.000