 3
3peptides
spectra
0.000 | 0.034
0.000 | 0.000
0.000 | 0.170
0.000 | 0.333
0.000 | 0.338
0.000 | 0.263
0.062 | 0.202
0.376 | 0.530
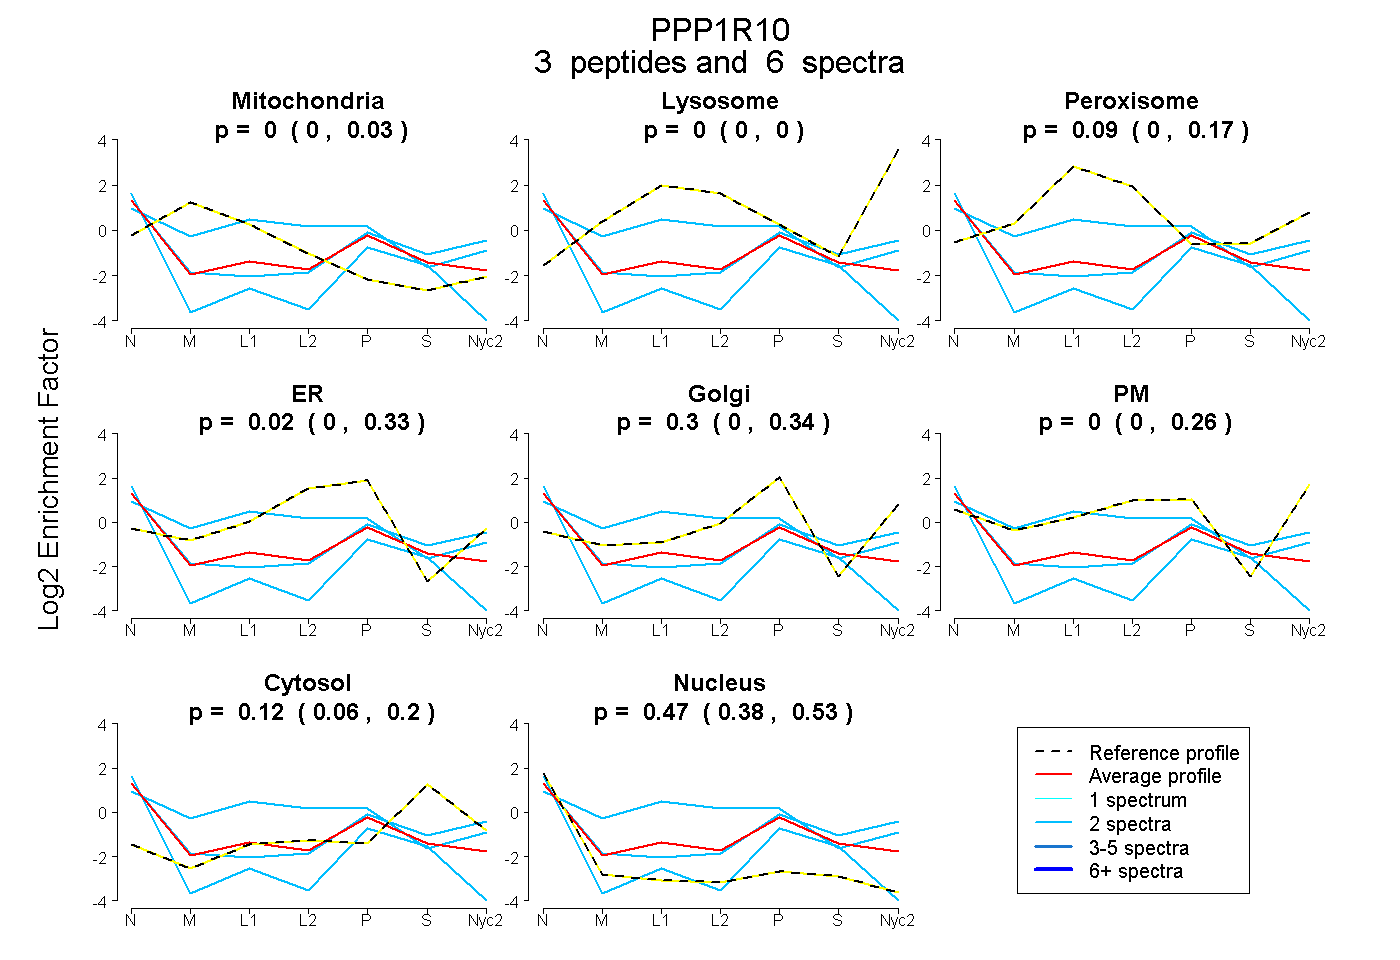
| Plot | Mito | Lyso | Perox | ER | Golgi | PM | Cytosol | Nucleus | |||||
| Expt A |
3 peptides |
6 spectra |
|
0.000 0.000 | 0.034 |
0.000 0.000 | 0.000 |
0.088 0.000 | 0.170 |
0.022 0.000 | 0.333 |
0.296 0.000 | 0.338 |
0.000 0.000 | 0.263 |
0.121 0.062 | 0.202 |
0.473 0.376 | 0.530 |
| 2 spectra, TTLPERPLTEVK | 0.000 | 0.000 | 0.000 | 0.000 | 0.015 | 0.000 | 0.156 | 0.829 | ||
| 2 spectra, TTAPSHAK | 0.000 | 0.000 | 0.000 | 0.000 | 0.257 | 0.163 | 0.225 | 0.354 | ||
| 2 spectra, GPPPHEHR | 0.085 | 0.000 | 0.313 | 0.273 | 0.000 | 0.118 | 0.000 | 0.211 |