 14
14peptides
spectra
0.000 | 0.000
0.000 | 0.000
0.000 | 0.000
0.014 | 0.074
0.199 | 0.274
0.000 | 0.000
0.632 | 0.640
0.067 | 0.085
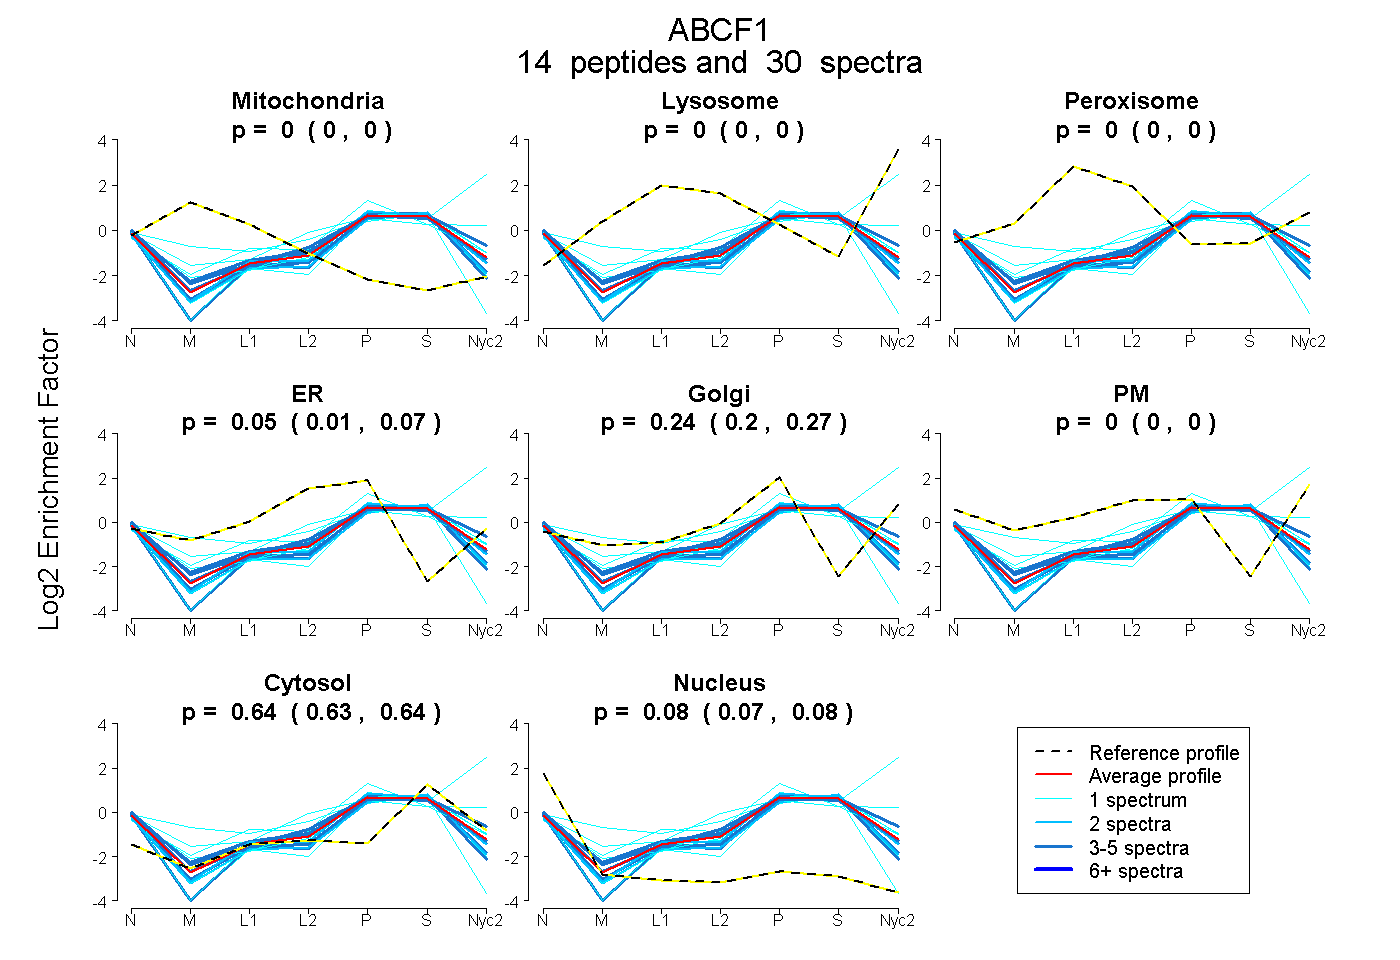
| Plot | Mito | Lyso | Perox | ER | Golgi | PM | Cytosol | Nucleus | |||||
| Expt A |
14 peptides |
30 spectra |
|
0.000 0.000 | 0.000 |
0.000 0.000 | 0.000 |
0.000 0.000 | 0.000 |
0.046 0.014 | 0.074 |
0.241 0.199 | 0.274 |
0.000 0.000 | 0.000 |
0.636 0.632 | 0.640 |
0.077 0.067 | 0.085 |
| 1 spectrum, EQQQQQQQQK | 0.000 | 0.000 | 0.000 | 0.000 | 0.260 | 0.000 | 0.668 | 0.072 | ||
| 1 spectrum, GAVIVVSHDAR | 0.000 | 0.226 | 0.000 | 0.000 | 0.143 | 0.211 | 0.419 | 0.000 | ||
| 1 spectrum, FSGGWR | 0.000 | 0.000 | 0.000 | 0.018 | 0.426 | 0.000 | 0.514 | 0.042 | ||
| 2 spectra, GFNLPYQDAR | 0.000 | 0.000 | 0.000 | 0.005 | 0.148 | 0.000 | 0.693 | 0.154 | ||
| 1 spectrum, ICIVGPNGVGK | 0.000 | 0.000 | 0.000 | 0.151 | 0.000 | 0.000 | 0.581 | 0.268 | ||
| 3 spectra, EVLEALGEVMVNRPR | 0.000 | 0.000 | 0.000 | 0.145 | 0.030 | 0.000 | 0.656 | 0.169 | ||
| 4 spectra, NLDFGIDMDSR | 0.000 | 0.000 | 0.000 | 0.005 | 0.339 | 0.000 | 0.641 | 0.015 | ||
| 1 spectrum, ANDPYAHLSK | 0.000 | 0.000 | 0.000 | 0.237 | 0.070 | 0.000 | 0.694 | 0.000 | ||
| 2 spectra, QMDYER | 0.000 | 0.000 | 0.000 | 0.023 | 0.237 | 0.000 | 0.658 | 0.082 | ||
| 1 spectrum, ILAGLGFDPEMQNRPTQK | 0.000 | 0.000 | 0.022 | 0.000 | 0.157 | 0.333 | 0.488 | 0.000 | ||
| 5 spectra, VYEELR | 0.000 | 0.000 | 0.000 | 0.172 | 0.147 | 0.000 | 0.602 | 0.078 | ||
| 1 spectrum, AANAAENDFSVSQAEVSSR | 0.000 | 0.000 | 0.000 | 0.000 | 0.123 | 0.000 | 0.685 | 0.192 | ||
| 3 spectra, AVAEEPPGLR | 0.000 | 0.000 | 0.000 | 0.000 | 0.162 | 0.000 | 0.687 | 0.150 | ||
| 4 spectra, ATGAAAAEAK | 0.000 | 0.000 | 0.000 | 0.122 | 0.151 | 0.000 | 0.628 | 0.099 |
| Plot | Mito | Lyso or Perox | ER | Golgi | PM | Cytosol | Nucleus | ||||||
| Expt B |
6 peptides |
11 spectra |
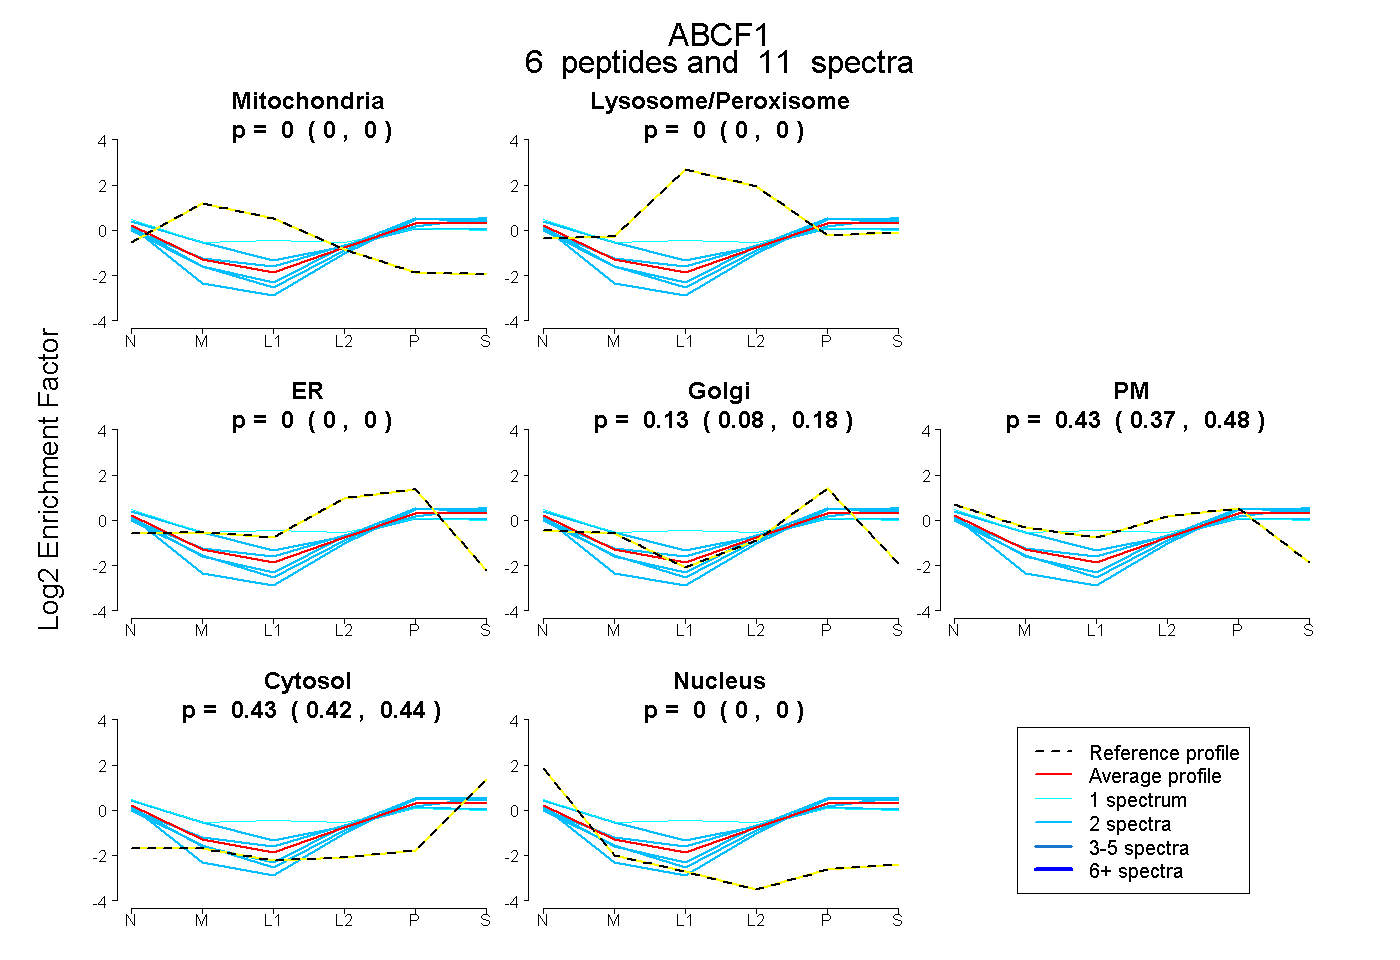 |
0.000 0.000 | 0.000 |
0.000 0.000 | 0.000 |
0.000 0.000 | 0.000 |
0.134 0.082 | 0.183 |
0.434 0.374 | 0.480 |
0.432 0.418 | 0.443 |
0.000 0.000 | 0.000 |
|||
| Plot | Lyso | Other | |||||||||||
| Expt C |
8 peptides |
17 spectra |
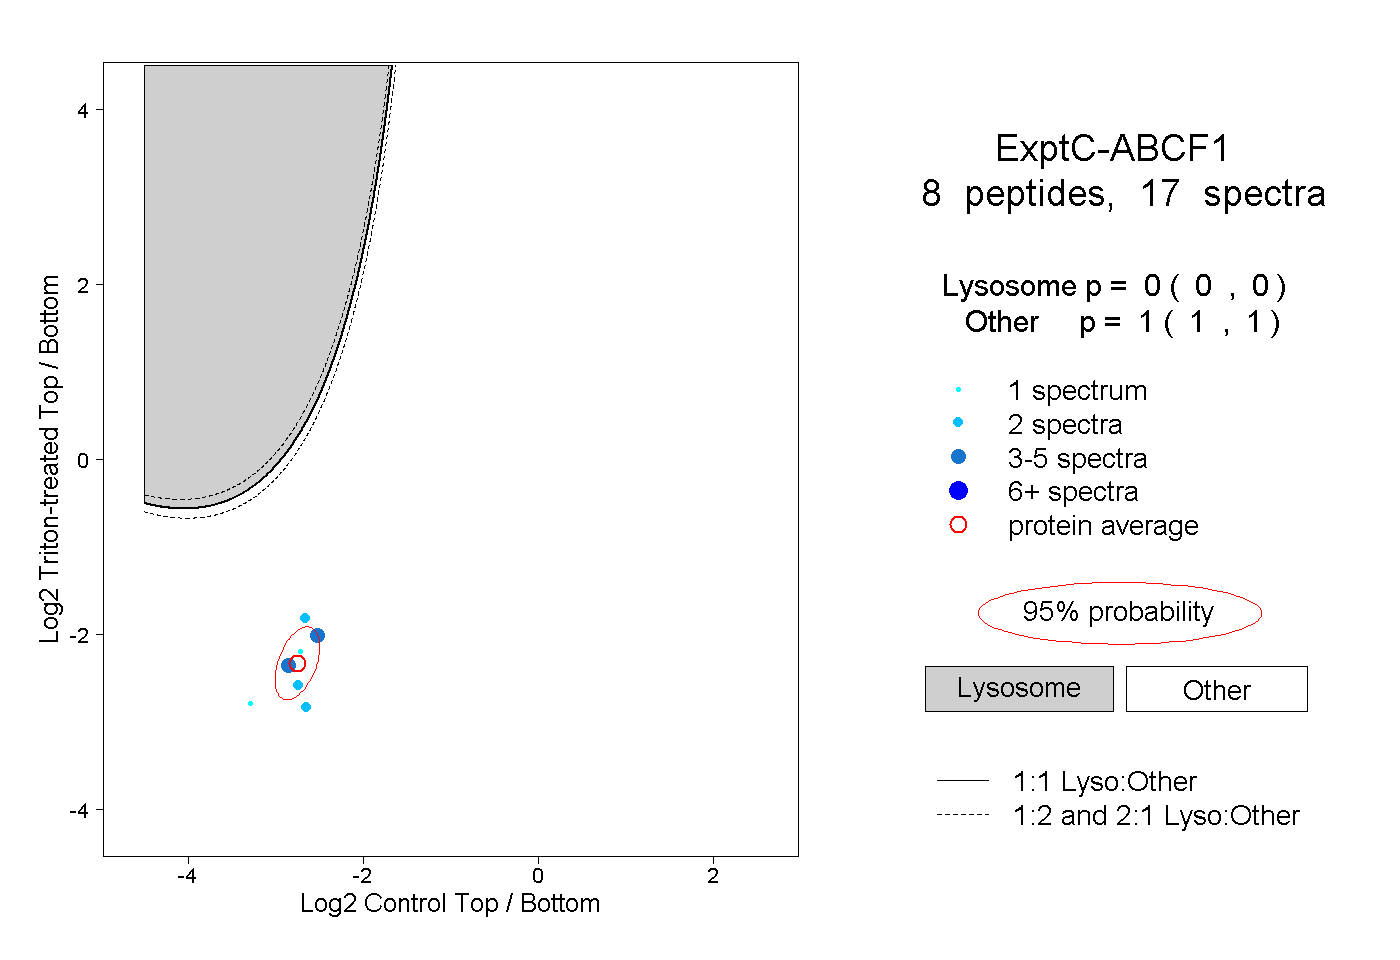 |
0.000 0.000 | 0.000 |
1.000 1.000 | 1.000 |
||||||||
| Plot | Lyso | Other | |||||||||||
| Expt D |
4 peptides |
10 spectra |
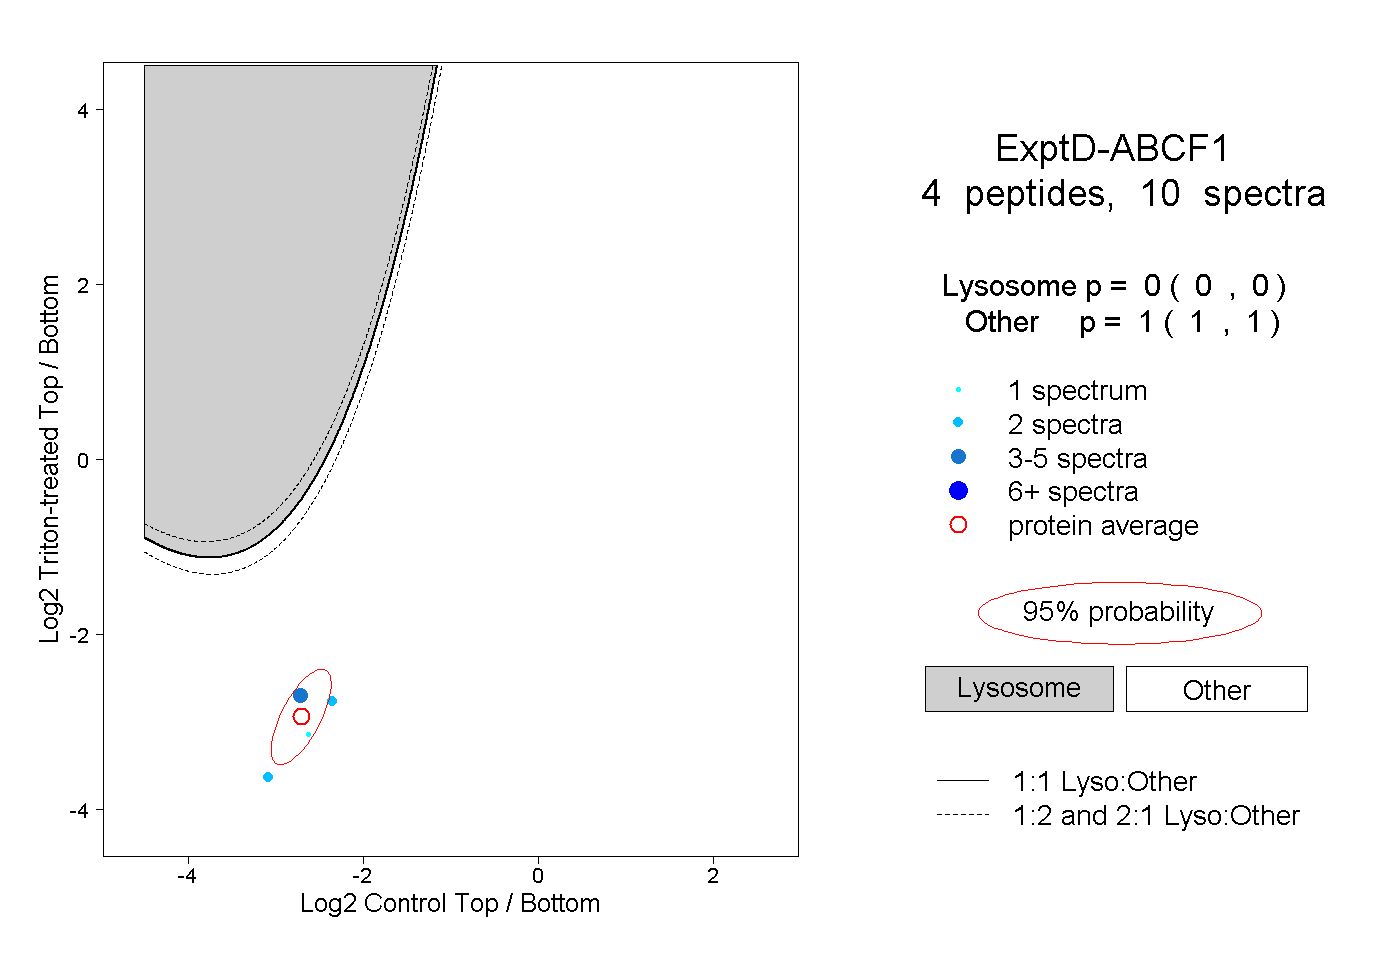 |
0.000 0.000 | 0.000 |
1.000 1.000 | 1.000 |