 4
4peptides
spectra
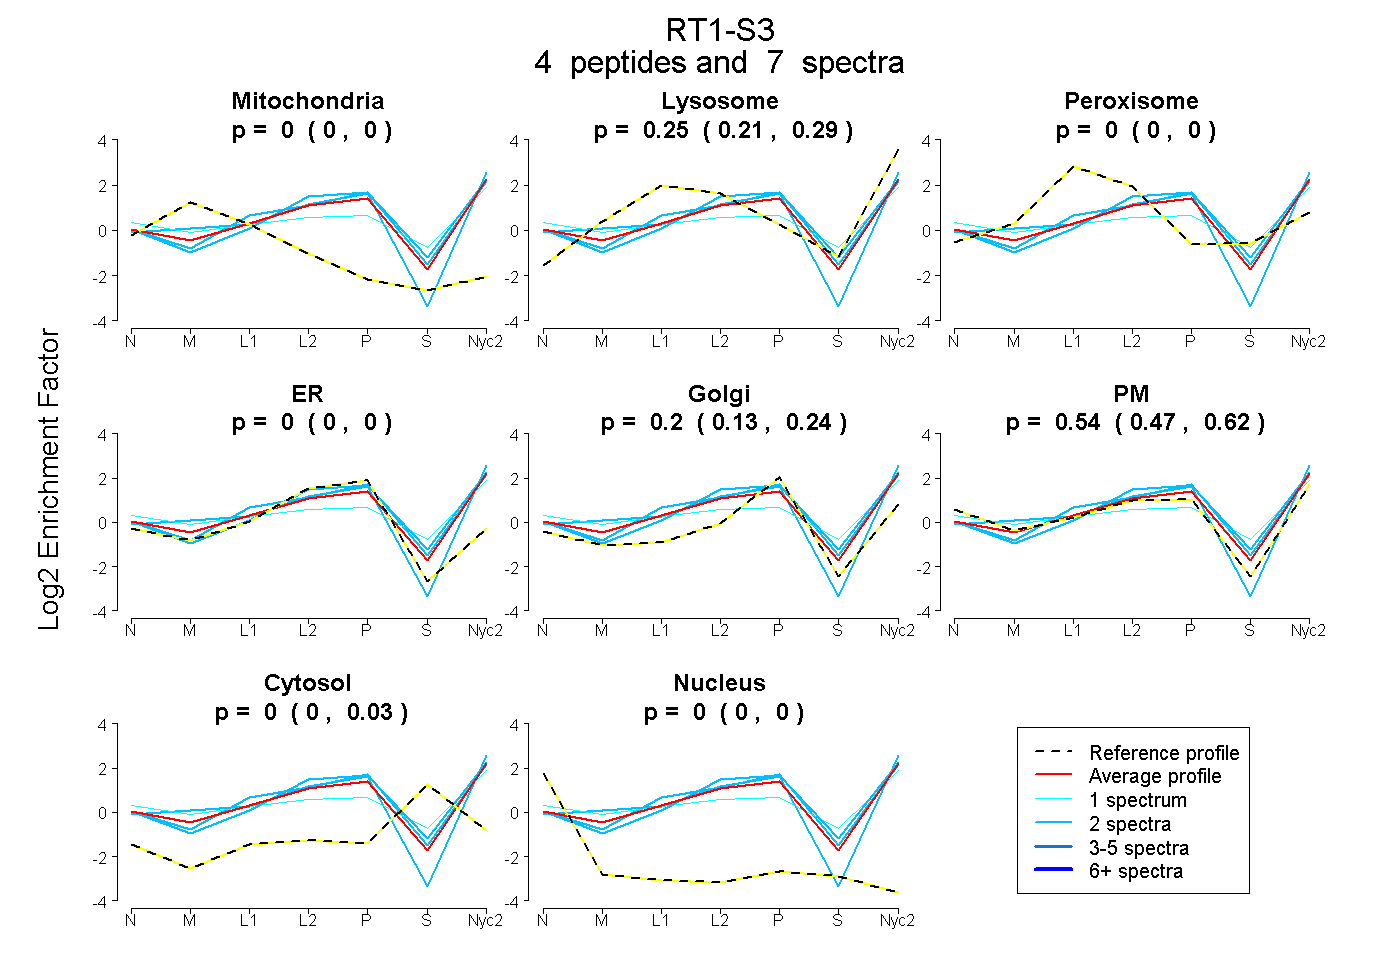
0.000 | 0.000
0.206 | 0.287
0.000 | 0.000
0.000 | 0.000
0.127 | 0.242
0.472 | 0.624
0.000 | 0.032
0.000 | 0.000
| Plot | Mito | Lyso | Perox | ER | Golgi | PM | Cytosol | Nucleus | |||||
| Expt A |
4 peptides |
7 spectra |
|
0.000 0.000 | 0.000 |
0.253 0.206 | 0.287 |
0.000 0.000 | 0.000 |
0.000 0.000 | 0.000 |
0.203 0.127 | 0.242 |
0.544 0.472 | 0.624 |
0.000 0.000 | 0.032 |
0.000 0.000 | 0.000 |
| 2 spectra, GYCQEAYDGR | 0.000 | 0.290 | 0.000 | 0.020 | 0.243 | 0.447 | 0.000 | 0.000 | ||
| 1 spectrum, WAAVVVPSGEELK | 0.000 | 0.223 | 0.016 | 0.000 | 0.000 | 0.588 | 0.174 | 0.000 | ||
| 2 spectra, YDSDVENPR | 0.000 | 0.263 | 0.000 | 0.024 | 0.229 | 0.453 | 0.030 | 0.000 | ||
| 2 spectra, DYISLNEDLR | 0.000 | 0.150 | 0.000 | 0.000 | 0.069 | 0.781 | 0.000 | 0.000 |
| Plot | Lyso | Other | |||||||||||
| Expt C |
2 peptides |
2 spectra |
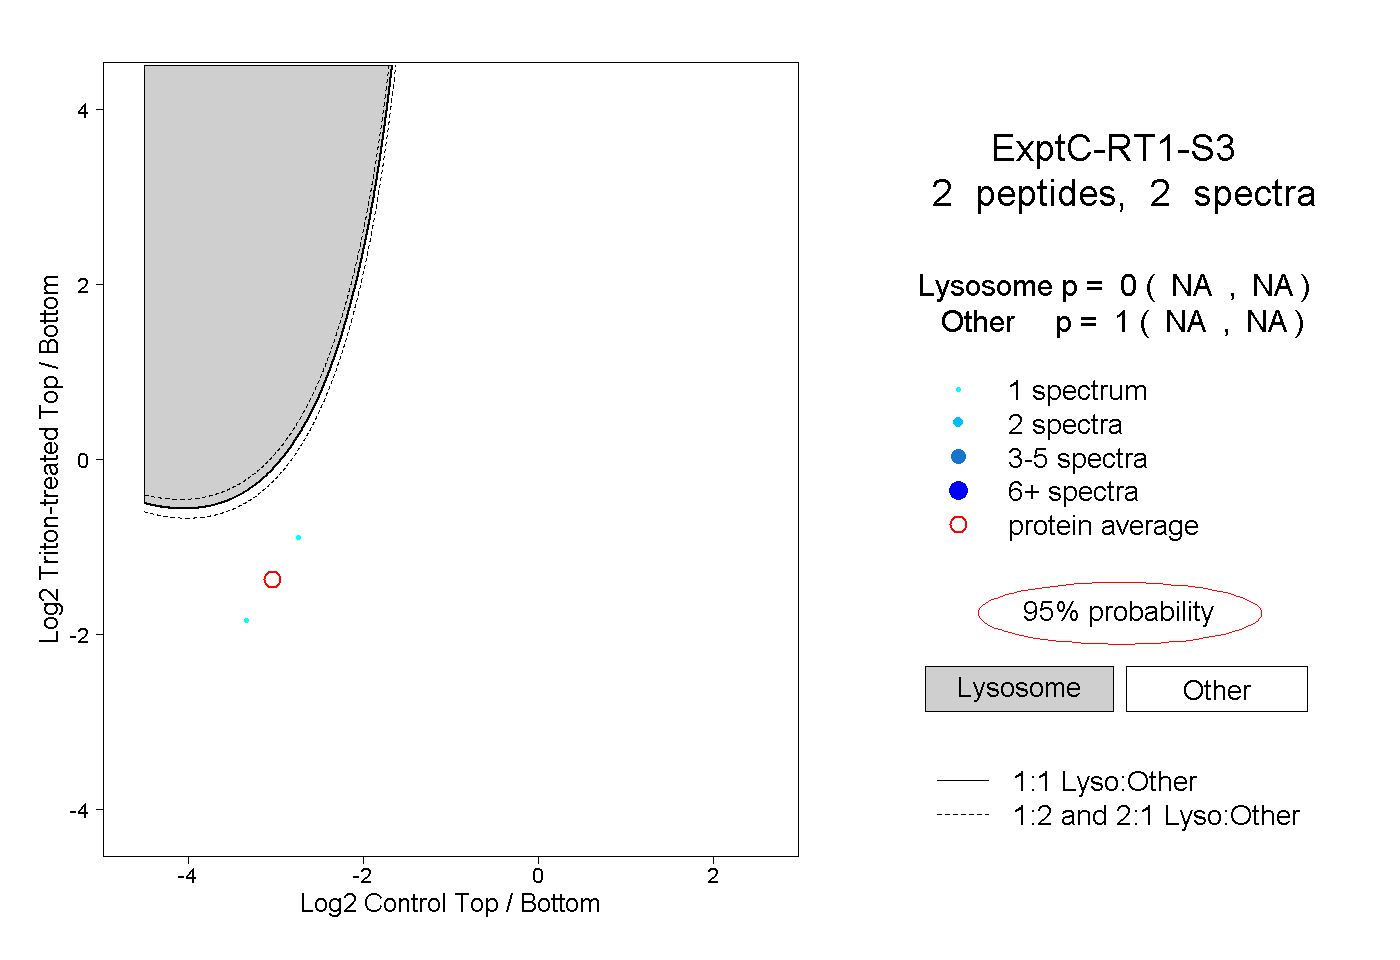 |
0.000 NA | NA |
1.000 NA | NA |