 3
3peptides
spectra
0.000 | 0.029
0.000 | 0.000
0.000 | 0.100
0.000 | 0.000
0.000 | 0.000
0.000 | 0.075
0.644 | 0.739
0.183 | 0.283
1peptide
spectrum
NA | NA
NA | NA
NA | NA
NA | NA
NA | NA
NA | NA
NA | NA
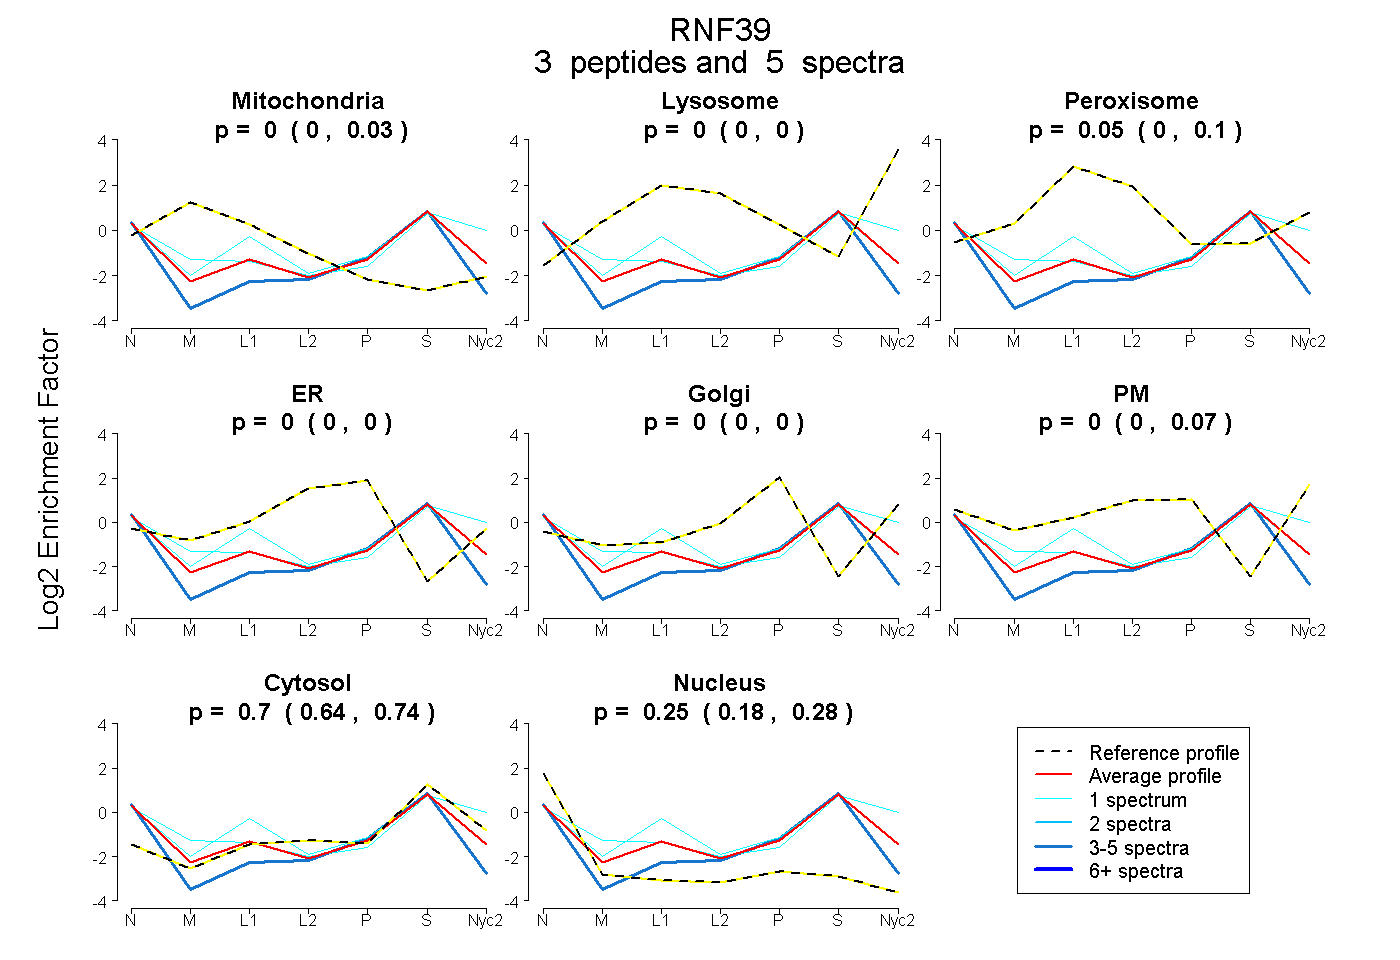
| Plot | Mito | Lyso | Perox | ER | Golgi | PM | Cytosol | Nucleus | |||||
| Expt A |
3 peptides |
5 spectra |
|
0.000 0.000 | 0.029 |
0.000 0.000 | 0.000 |
0.054 0.000 | 0.100 |
0.000 0.000 | 0.000 |
0.000 0.000 | 0.000 |
0.000 0.000 | 0.075 |
0.697 0.644 | 0.739 |
0.249 0.183 | 0.283 |
||
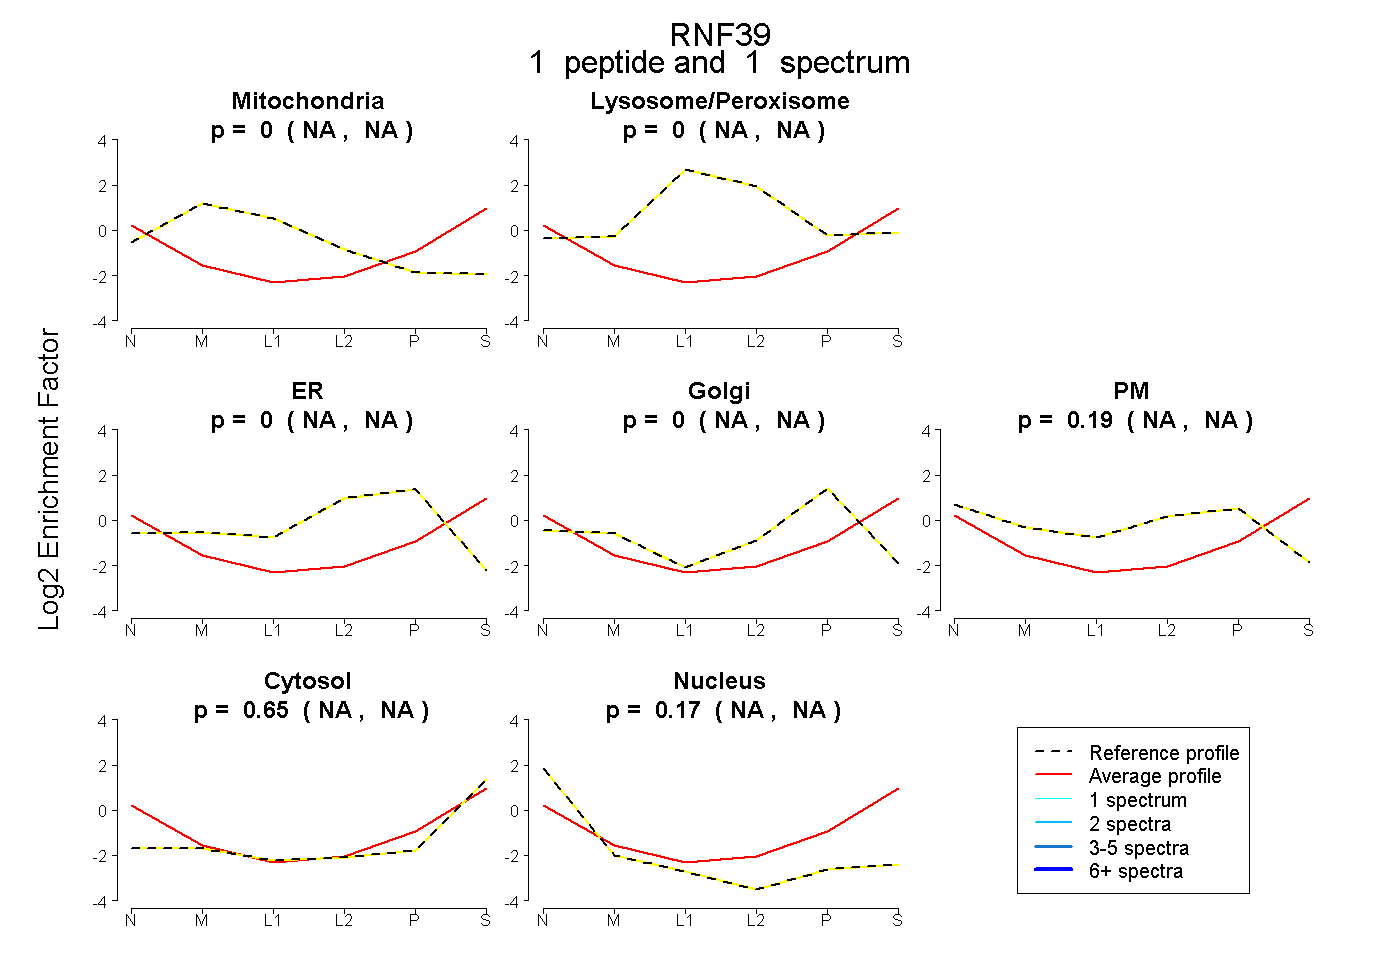
| Plot | Mito | Lyso or Perox | ER | Golgi | PM | Cytosol | Nucleus | ||||||
| Expt B |
1 peptide |
1 spectrum |
|
0.000 NA | NA |
0.000 NA | NA |
0.000 NA | NA |
0.000 NA | NA |
0.186 NA | NA |
0.649 NA | NA |
0.165 NA | NA |
| 1 spectrum, AVLGAQGFASGR | 0.000 | 0.000 | 0.000 | 0.000 | 0.186 | 0.649 | 0.165 |