 6
6peptides
spectra
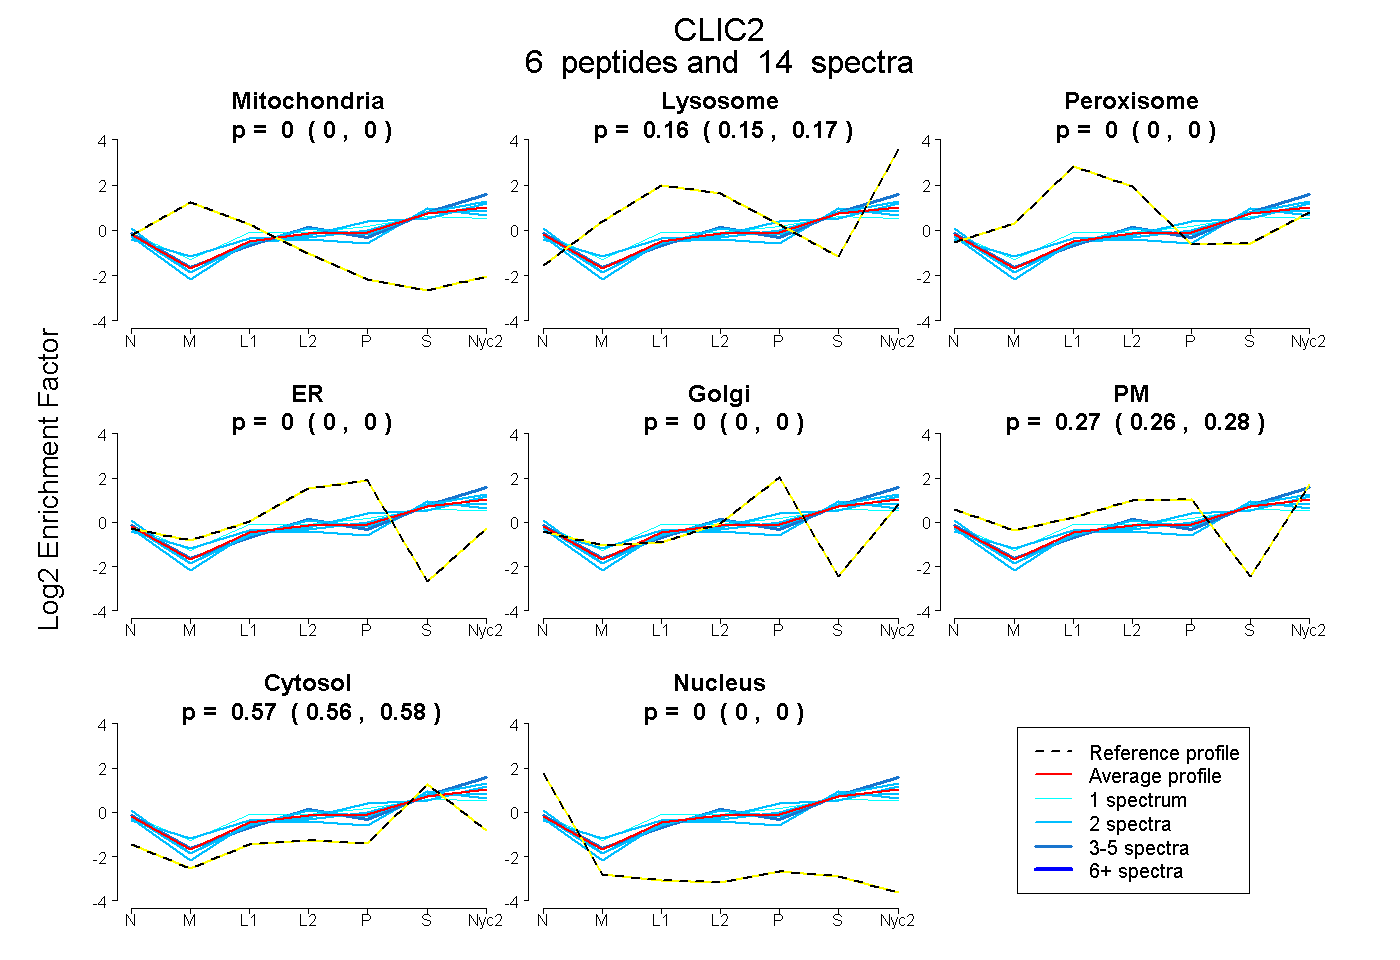
0.000 | 0.000
0.146 | 0.173
0.000 | 0.000
0.000 | 0.000
0.000 | 0.000
0.257 | 0.281
0.560 | 0.577
0.000 | 0.000
6peptides
spectra
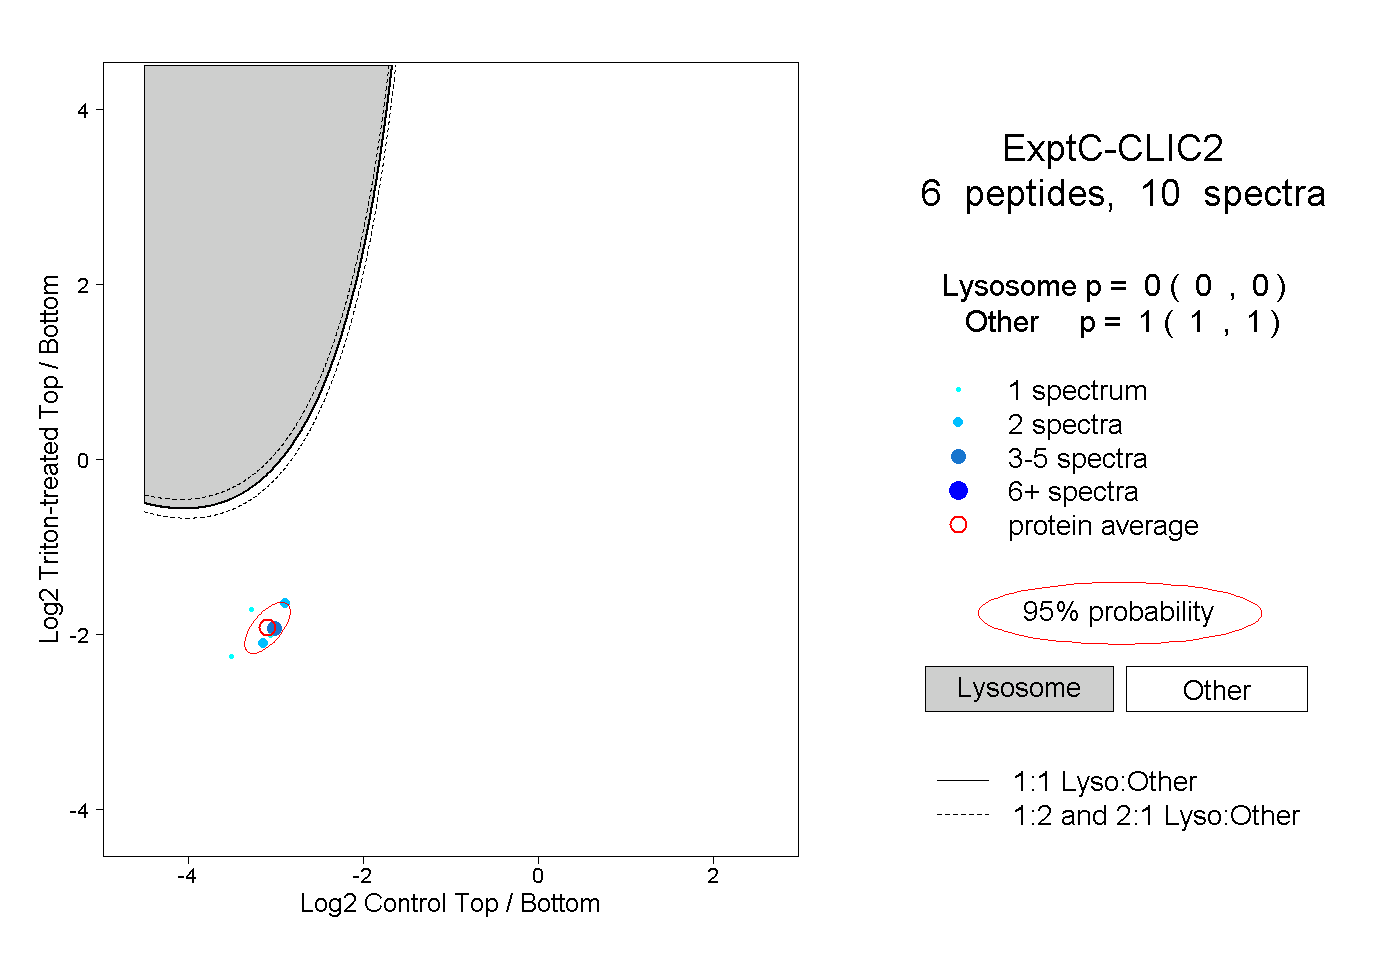
0.000 | 0.000
1.000 | 1.000
1peptide
spectrum
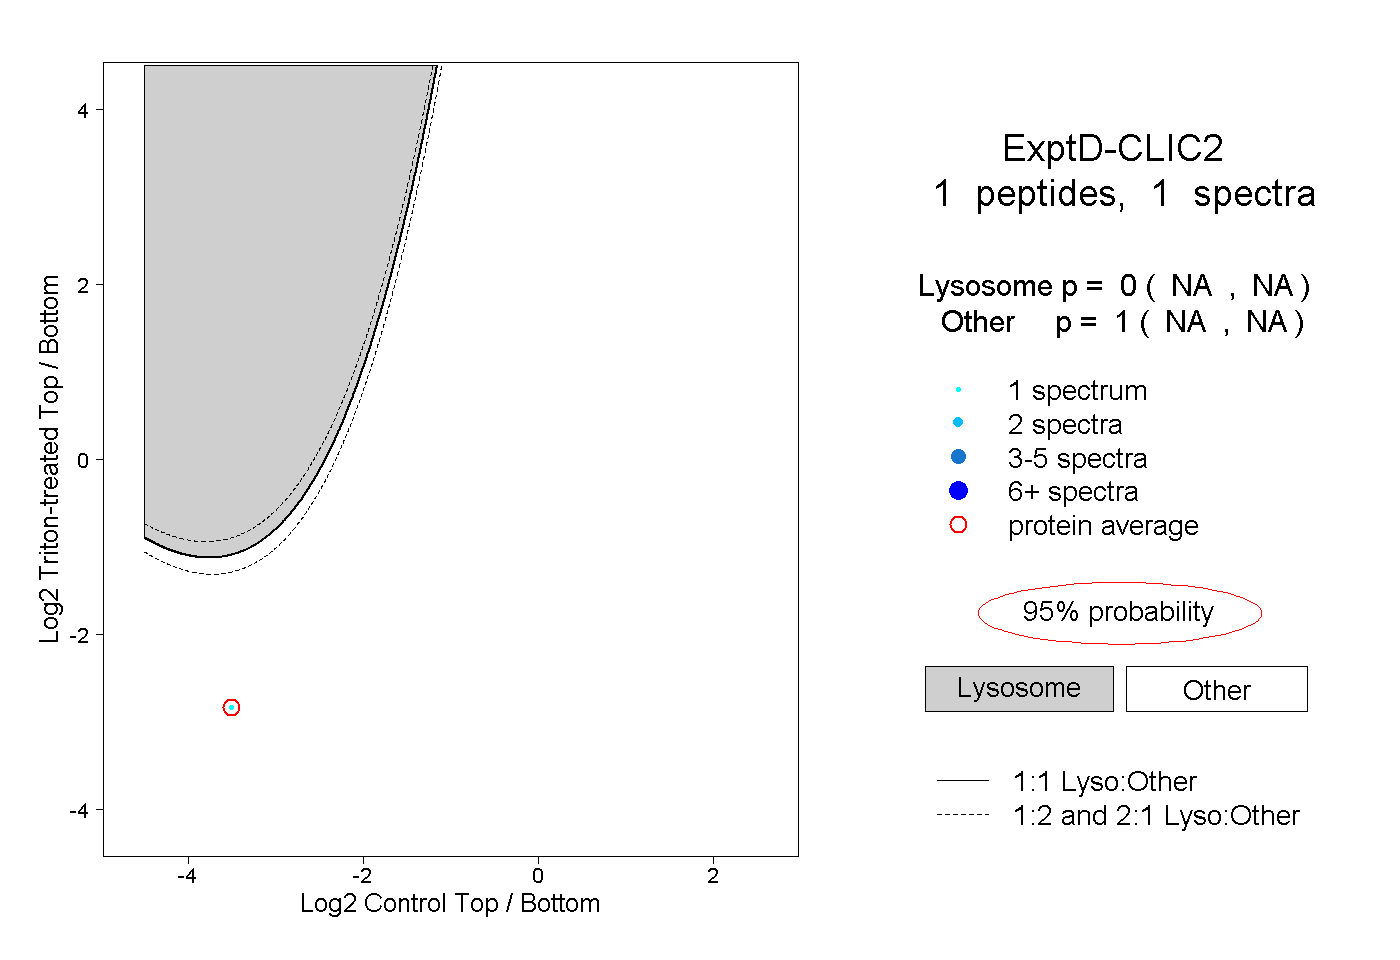
NA | NA
NA | NA