 12
12peptides
spectra
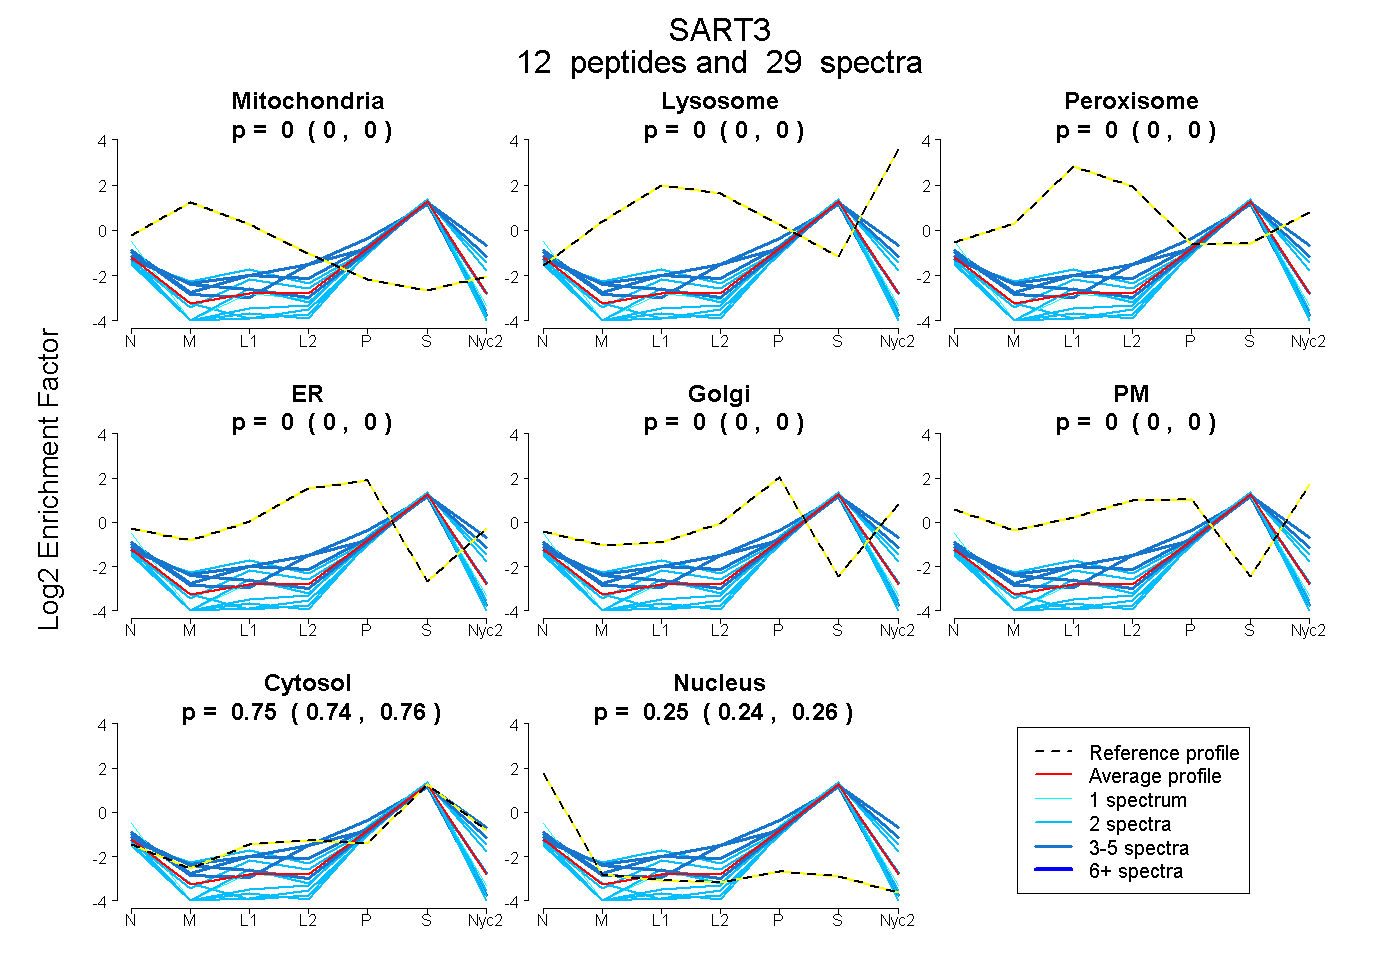
0.000 | 0.000
0.000 | 0.000
0.000 | 0.000
0.000 | 0.000
0.000 | 0.000
0.000 | 0.000
0.742 | 0.760
0.238 | 0.257
| Plot | Mito | Lyso | Perox | ER | Golgi | PM | Cytosol | Nucleus | |||||
| Expt A |
12 peptides |
29 spectra |
|
0.000 0.000 | 0.000 |
0.000 0.000 | 0.000 |
0.000 0.000 | 0.000 |
0.000 0.000 | 0.000 |
0.000 0.000 | 0.000 |
0.000 0.000 | 0.000 |
0.751 0.742 | 0.760 |
0.249 0.238 | 0.257 |
| 2 spectra, EFESAIVEAAR | 0.000 | 0.000 | 0.000 | 0.000 | 0.000 | 0.000 | 0.860 | 0.140 | ||
| 2 spectra, ALEYLQQEVEER | 0.000 | 0.000 | 0.000 | 0.000 | 0.000 | 0.000 | 0.604 | 0.396 | ||
| 1 spectrum, TQLSLLPR | 0.000 | 0.000 | 0.000 | 0.000 | 0.000 | 0.000 | 0.649 | 0.351 | ||
| 3 spectra, LEGELNK | 0.000 | 0.000 | 0.000 | 0.000 | 0.000 | 0.000 | 0.792 | 0.208 | ||
| 3 spectra, LFISGLPFSCTK | 0.000 | 0.000 | 0.000 | 0.000 | 0.000 | 0.000 | 0.748 | 0.252 | ||
| 2 spectra, TAPGAPMVPR | 0.000 | 0.000 | 0.000 | 0.000 | 0.000 | 0.000 | 0.652 | 0.348 | ||
| 2 spectra, IQLIFER | 0.000 | 0.000 | 0.000 | 0.000 | 0.000 | 0.000 | 0.649 | 0.351 | ||
| 4 spectra, VHSLFR | 0.000 | 0.000 | 0.000 | 0.000 | 0.000 | 0.000 | 0.852 | 0.148 | ||
| 2 spectra, VAISNPPQR | 0.000 | 0.000 | 0.000 | 0.000 | 0.000 | 0.000 | 0.679 | 0.321 | ||
| 2 spectra, GLAIWEAYR | 0.000 | 0.000 | 0.000 | 0.000 | 0.000 | 0.000 | 0.914 | 0.086 | ||
| 4 spectra, YSQYLDR | 0.000 | 0.000 | 0.000 | 0.000 | 0.048 | 0.000 | 0.919 | 0.033 | ||
| 2 spectra, NCPWTVALWSR | 0.000 | 0.000 | 0.000 | 0.000 | 0.000 | 0.000 | 0.603 | 0.397 |
| Plot | Lyso | Other | |||||||||||
| Expt C |
1 peptide |
1 spectrum |
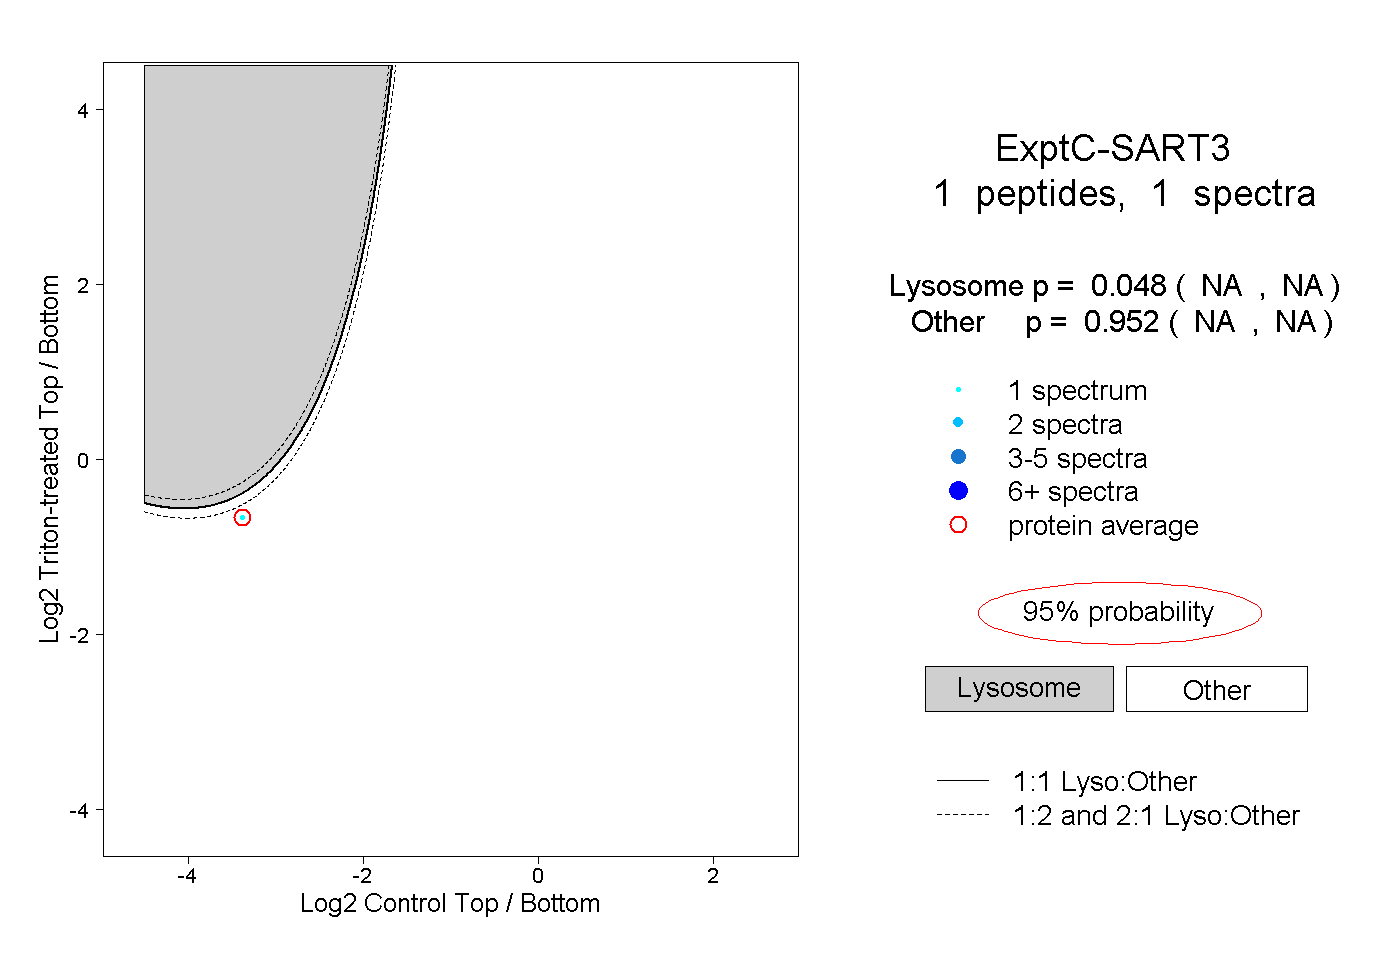 |
0.048 NA | NA |
0.952 NA | NA |