8
8peptides
spectra
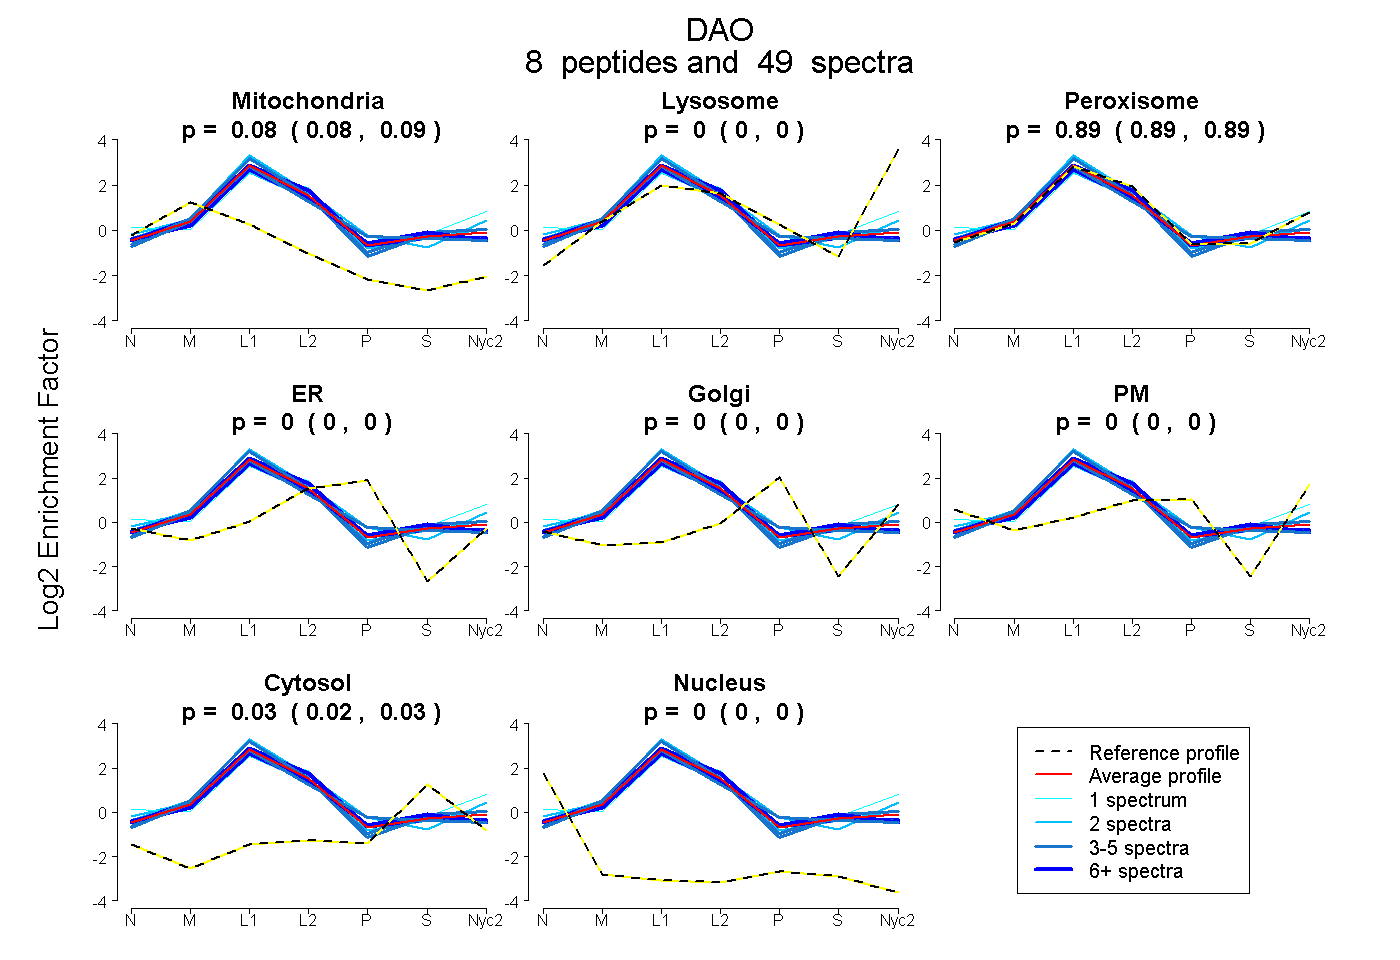
0.078 | 0.088
0.000 | 0.000
0.885 | 0.895
0.000 | 0.000
0.000 | 0.000
0.000 | 0.000
0.023 | 0.028
0.000 | 0.000
9peptides
spectra
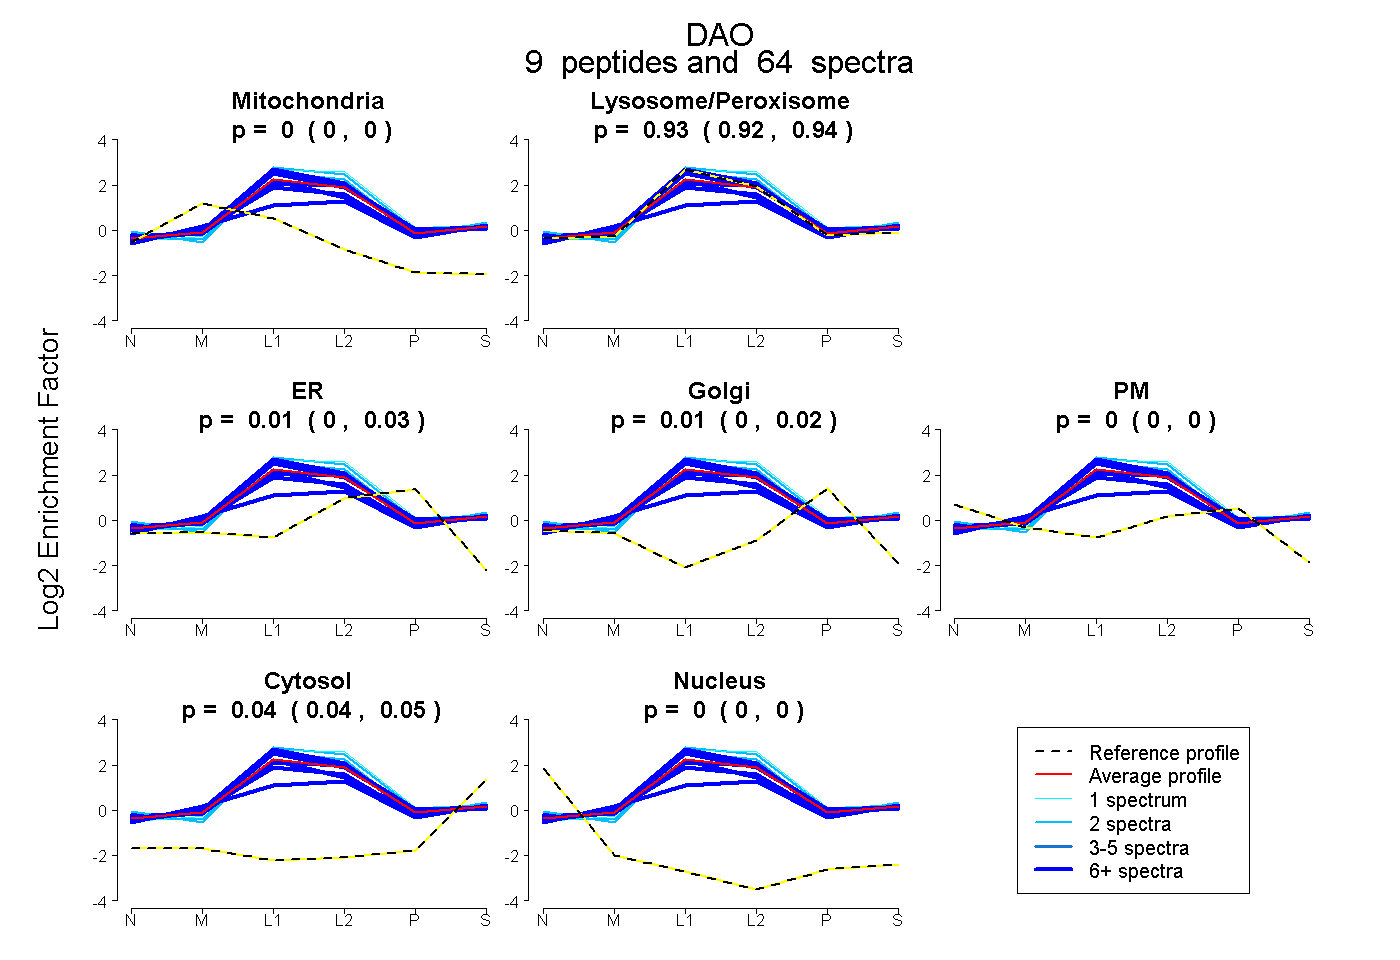
0.000 | 0.000
0.923 | 0.943
0.000 | 0.029
0.000 | 0.024
0.000 | 0.000
0.036 | 0.046
0.000 | 0.000
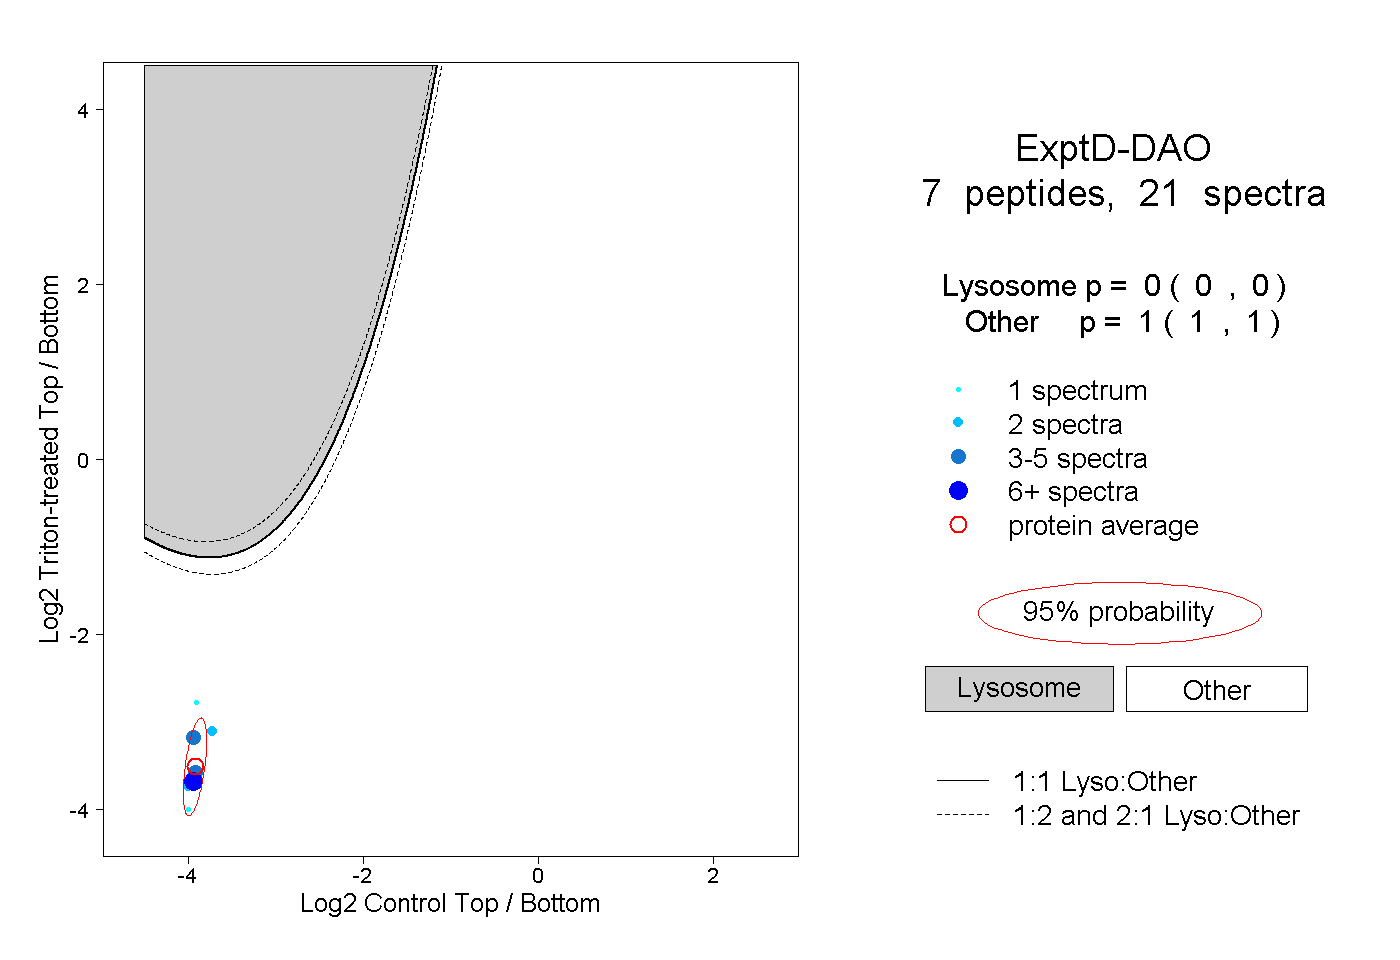
11peptides
spectra
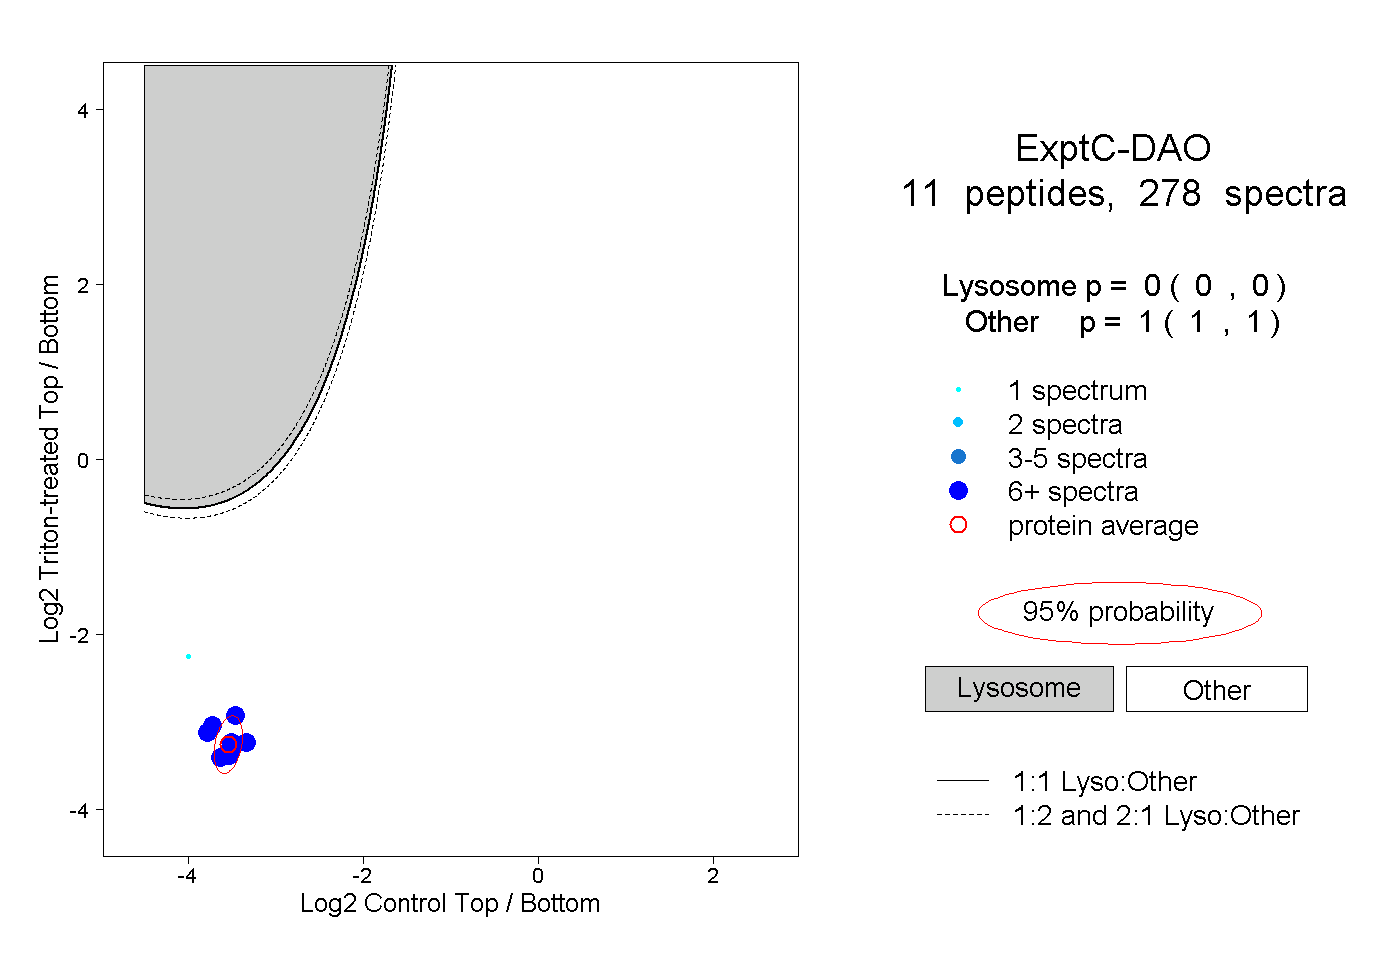
0.000 | 0.000
1.000 | 1.000