 4
4peptides
spectra
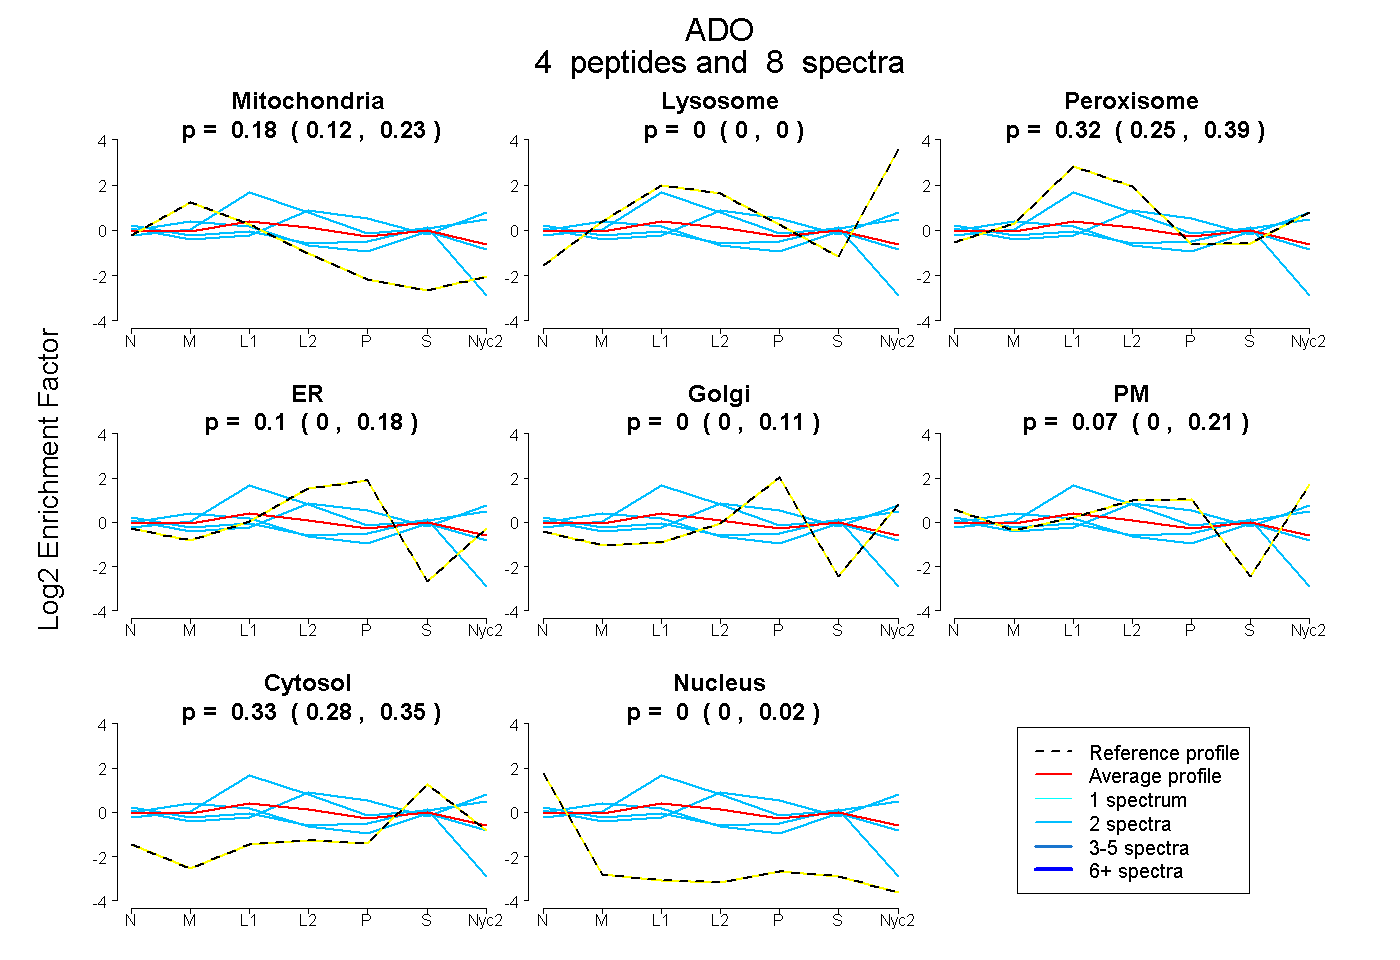
0.118 | 0.232
0.000 | 0.000
0.249 | 0.387
0.000 | 0.184
0.000 | 0.113
0.000 | 0.211
0.283 | 0.348
0.000 | 0.017
4peptides
spectra
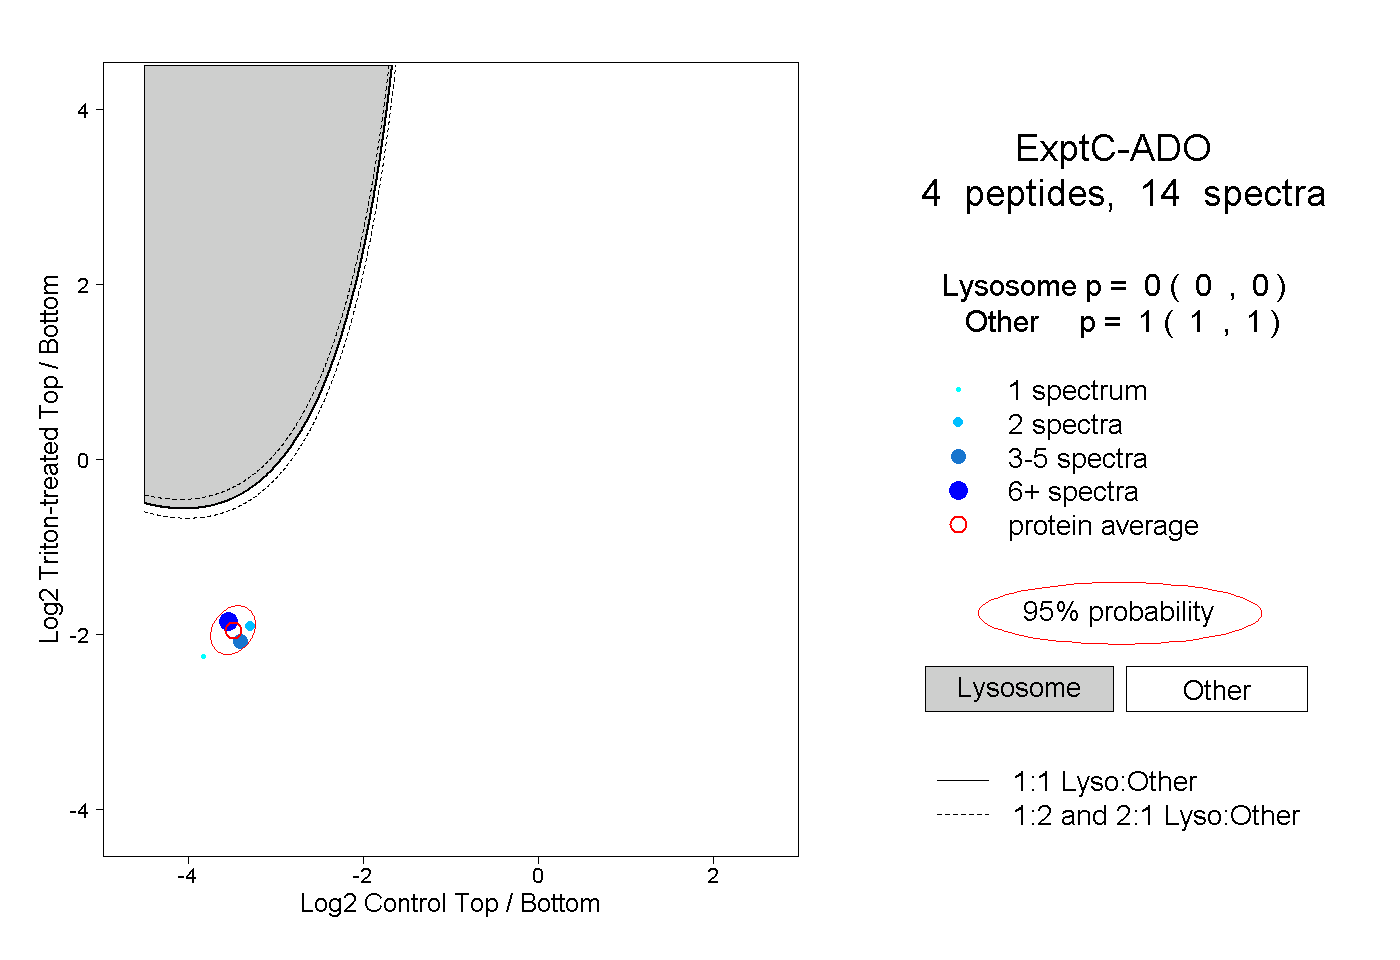
0.000 | 0.000
1.000 | 1.000
1peptide
spectra
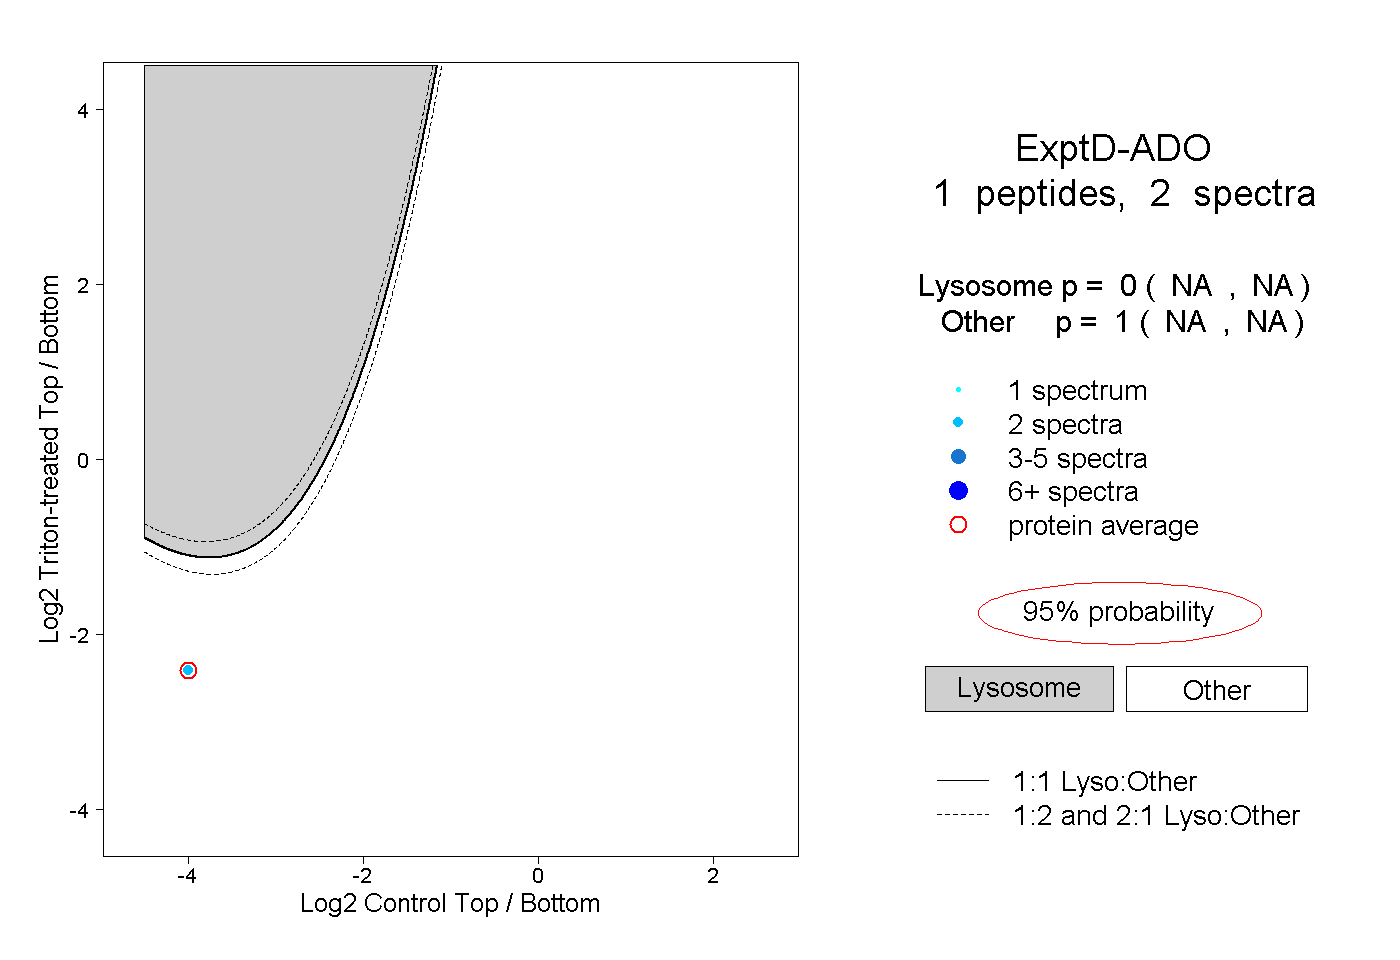
NA | NA
NA | NA