 4
4peptides
spectra
0.000 | 0.037
0.000 | 0.000
0.070 | 0.127
0.000 | 0.000
0.000 | 0.028
0.000 | 0.056
0.835 | 0.865
0.000 | 0.022
| Plot | Mito | Lyso | Perox | ER | Golgi | PM | Cytosol | Nucleus | |||||
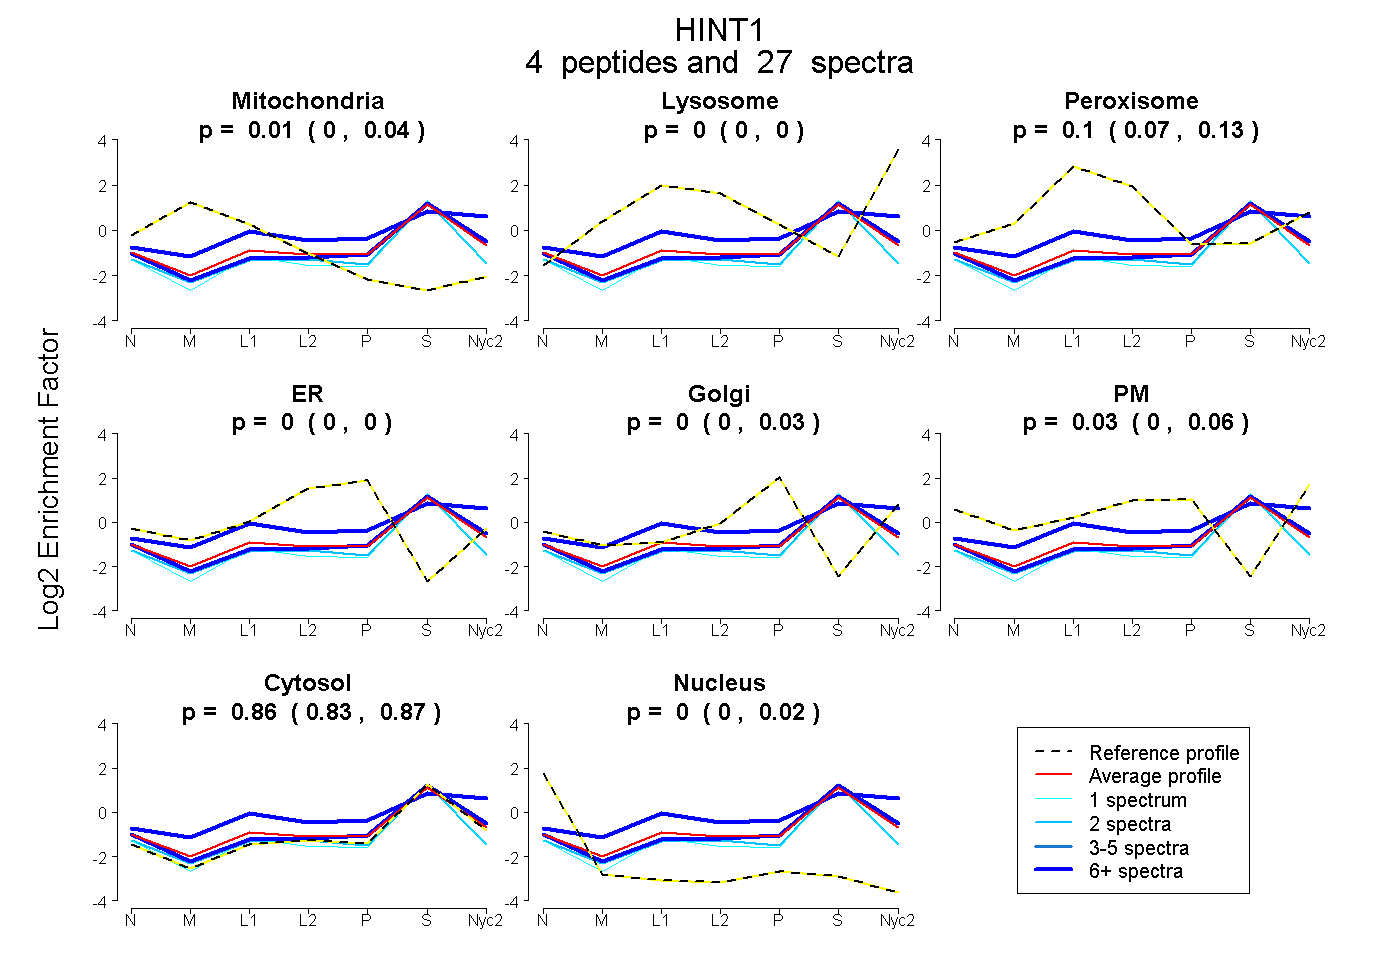
| Expt A |
4 peptides |
27 spectra |
|
0.014 0.000 | 0.037 |
0.000 0.000 | 0.000 |
0.096 0.070 | 0.127 |
0.000 0.000 | 0.000 |
0.000 0.000 | 0.028 |
0.031 0.000 | 0.056 |
0.855 0.835 | 0.865 |
0.003 0.000 | 0.022 |
| 1 spectrum, CLAFHDISPQAPTHFLVIPK | 0.000 | 0.000 | 0.000 | 0.000 | 0.000 | 0.000 | 0.944 | 0.056 | ||
| 12 spectra, IIFEDDR | 0.000 | 0.002 | 0.009 | 0.000 | 0.000 | 0.084 | 0.905 | 0.000 | ||
| 2 spectra, CAADLGLK | 0.043 | 0.000 | 0.000 | 0.000 | 0.000 | 0.000 | 0.931 | 0.027 | ||
| 12 spectra, QMNWPPG | 0.000 | 0.207 | 0.104 | 0.000 | 0.000 | 0.088 | 0.601 | 0.000 |
| Plot | Mito | Lyso or Perox | ER | Golgi | PM | Cytosol | Nucleus | ||||||
| Expt B |
1 peptide |
2 spectra |
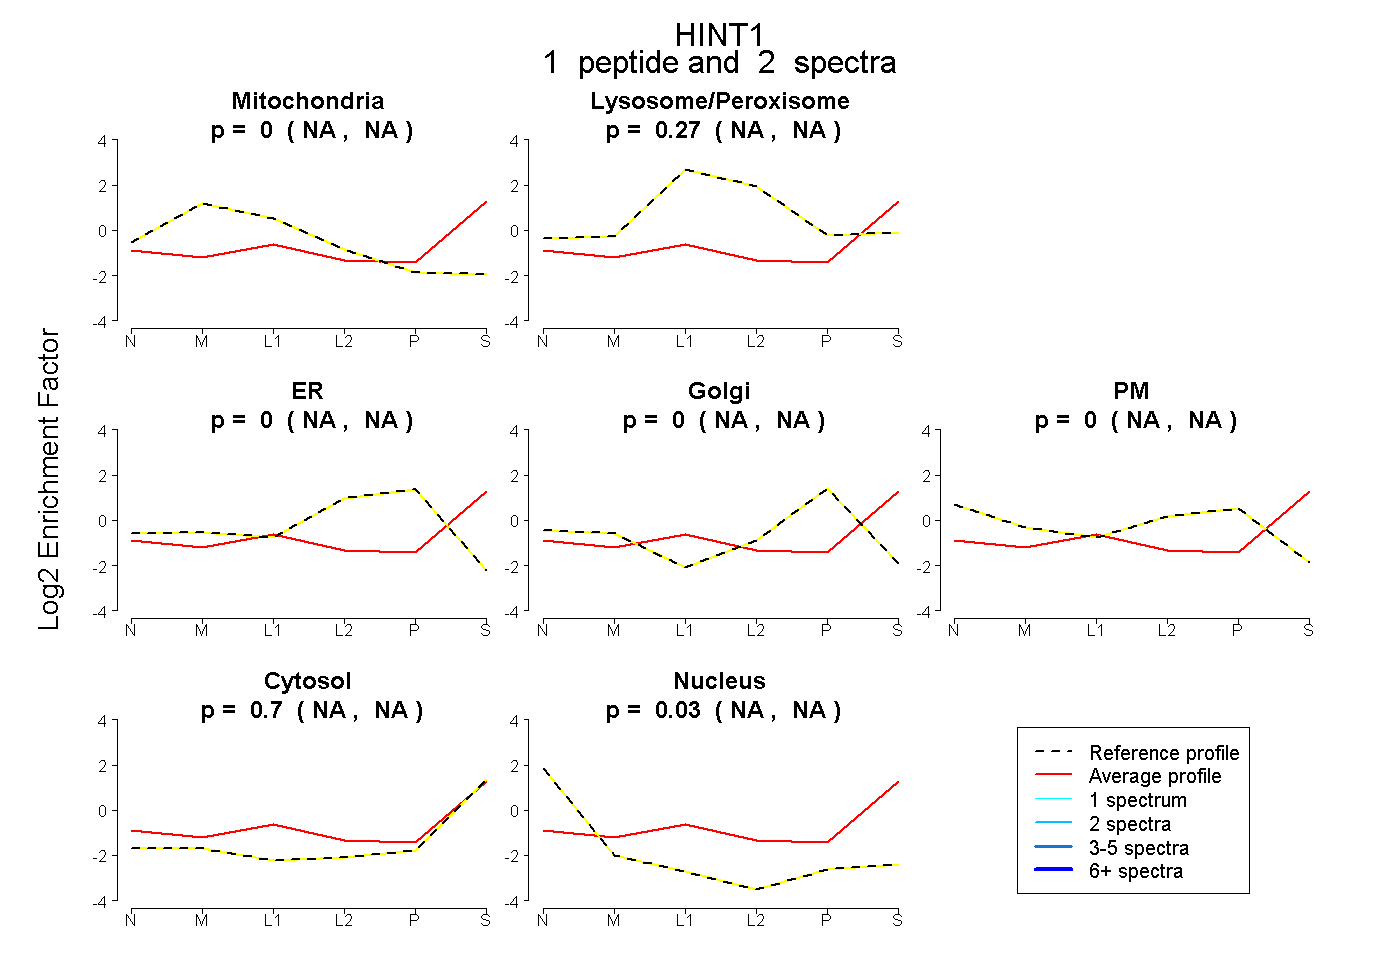 |
0.000 NA | NA |
0.272 NA | NA |
0.000 NA | NA |
0.000 NA | NA |
0.000 NA | NA |
0.699 NA | NA |
0.029 NA | NA |
|||
| Plot | Lyso | Other | |||||||||||
| Expt C |
3 peptides |
15 spectra |
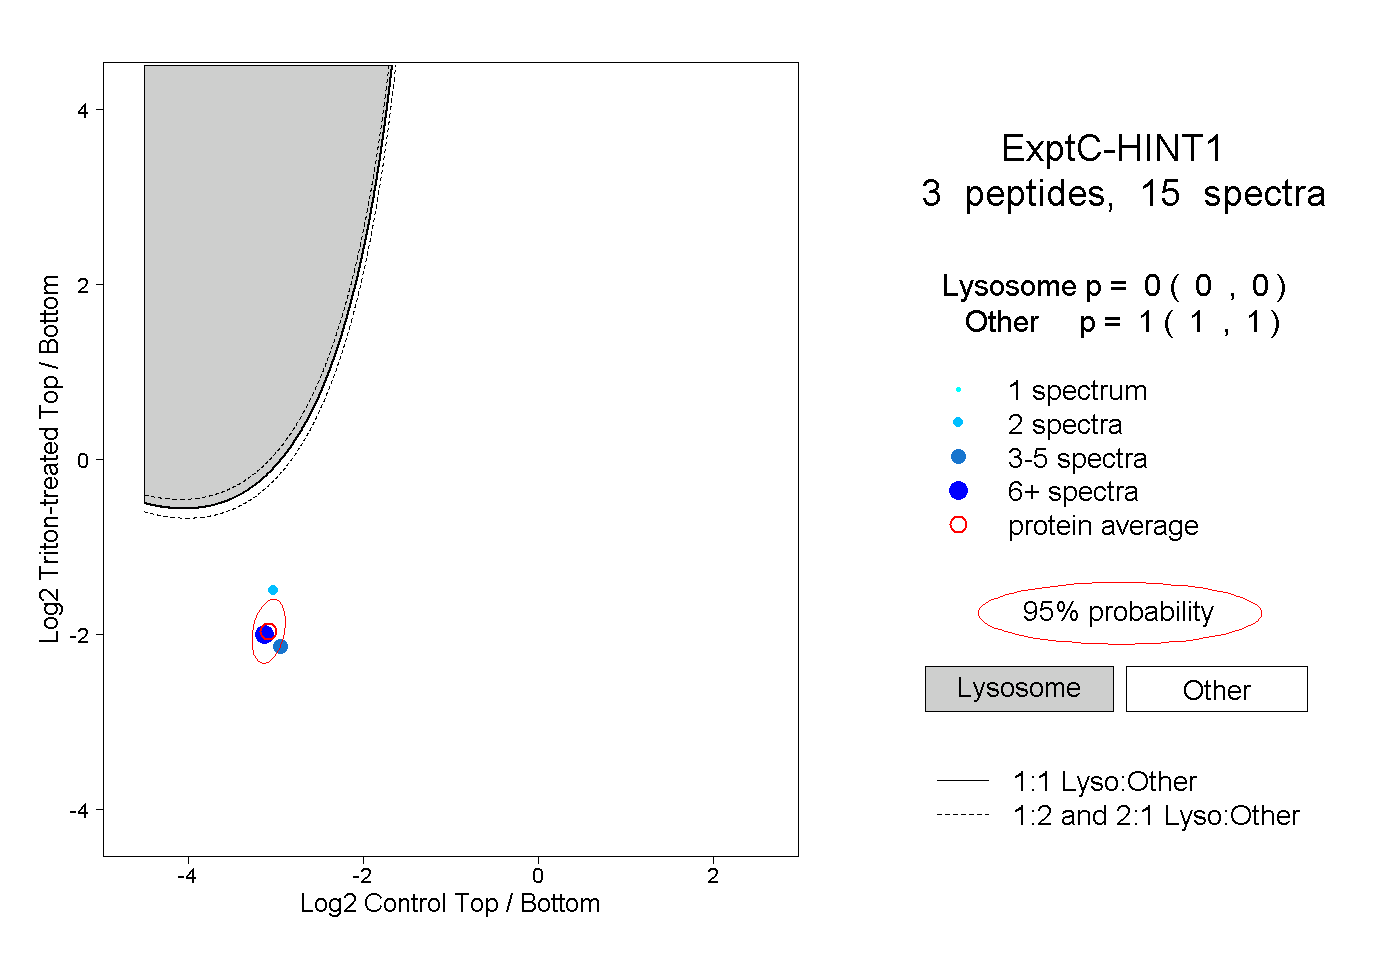 |
0.000 0.000 | 0.000 |
1.000 1.000 | 1.000 |
||||||||
| Plot | Lyso | Other | |||||||||||
| Expt D |
1 peptide |
2 spectra |
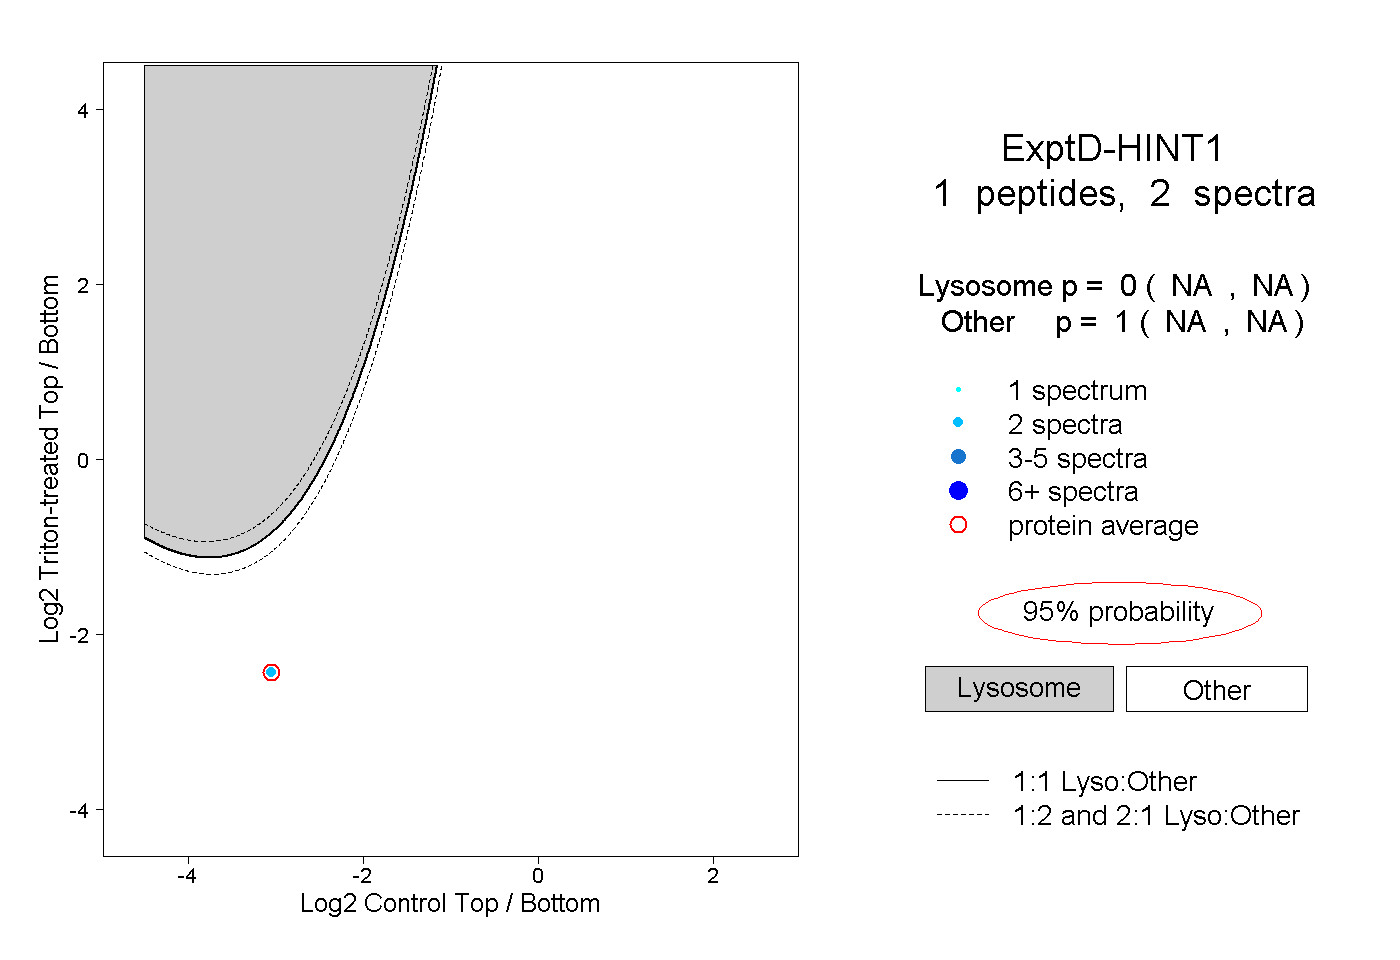 |
0.000 NA | NA |
1.000 NA | NA |