 11
11peptides
spectra
0.000 | 0.000
0.000 | 0.000
0.034 | 0.072
0.000 | 0.018
0.000 | 0.000
0.000 | 0.032
0.434 | 0.456
0.470 | 0.495
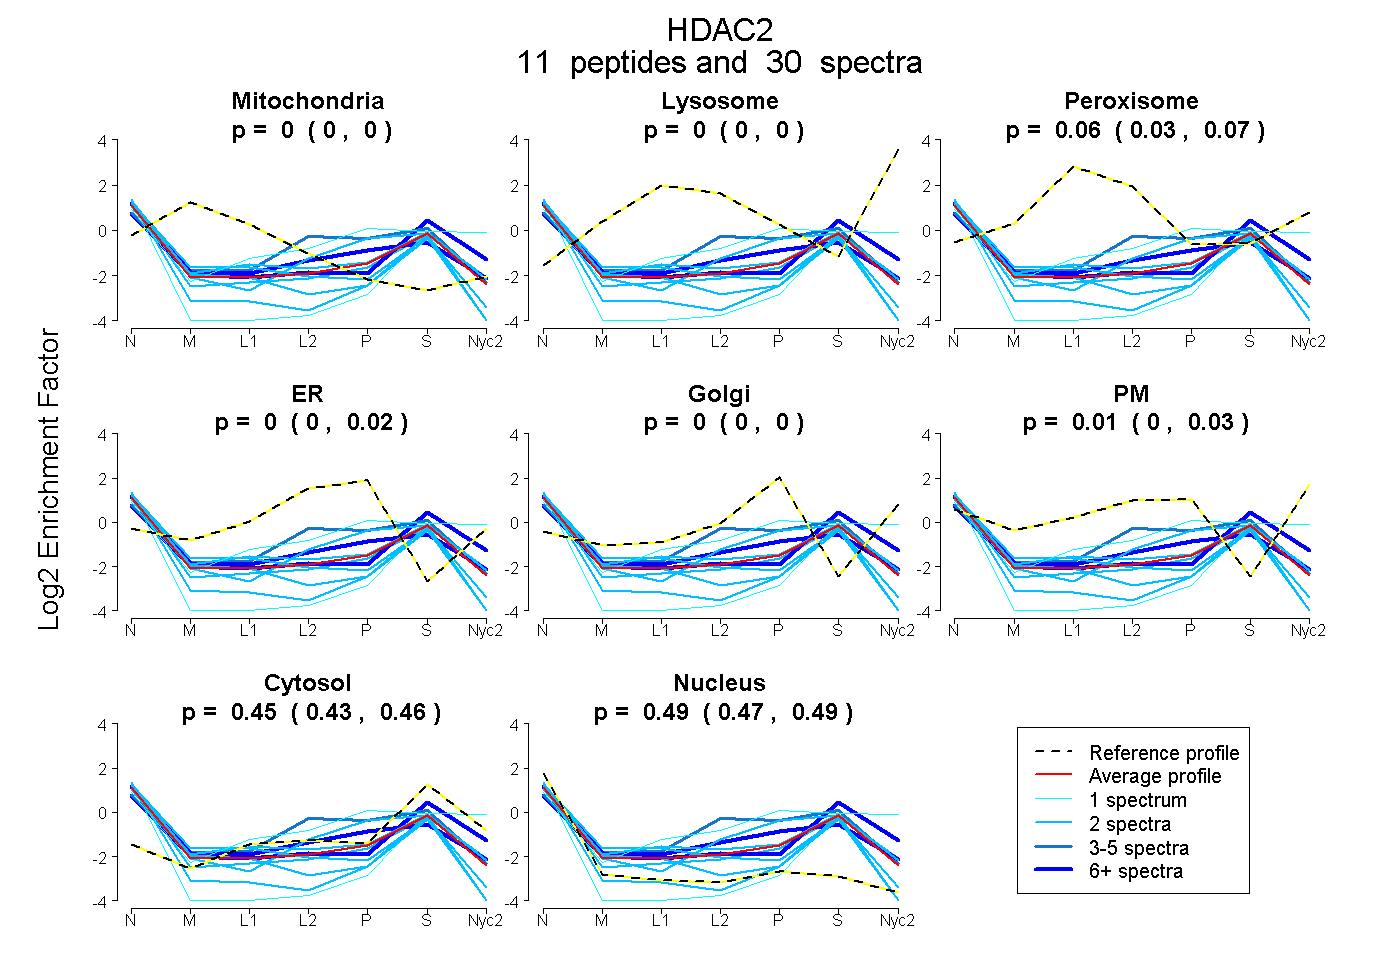
| Plot | Mito | Lyso | Perox | ER | Golgi | PM | Cytosol | Nucleus | |||||
| Expt A |
11 peptides |
30 spectra |
|
0.000 0.000 | 0.000 |
0.000 0.000 | 0.000 |
0.058 0.034 | 0.072 |
0.000 0.000 | 0.018 |
0.000 0.000 | 0.000 |
0.011 0.000 | 0.032 |
0.445 0.434 | 0.456 |
0.485 0.470 | 0.495 |