 3
3peptides
spectra
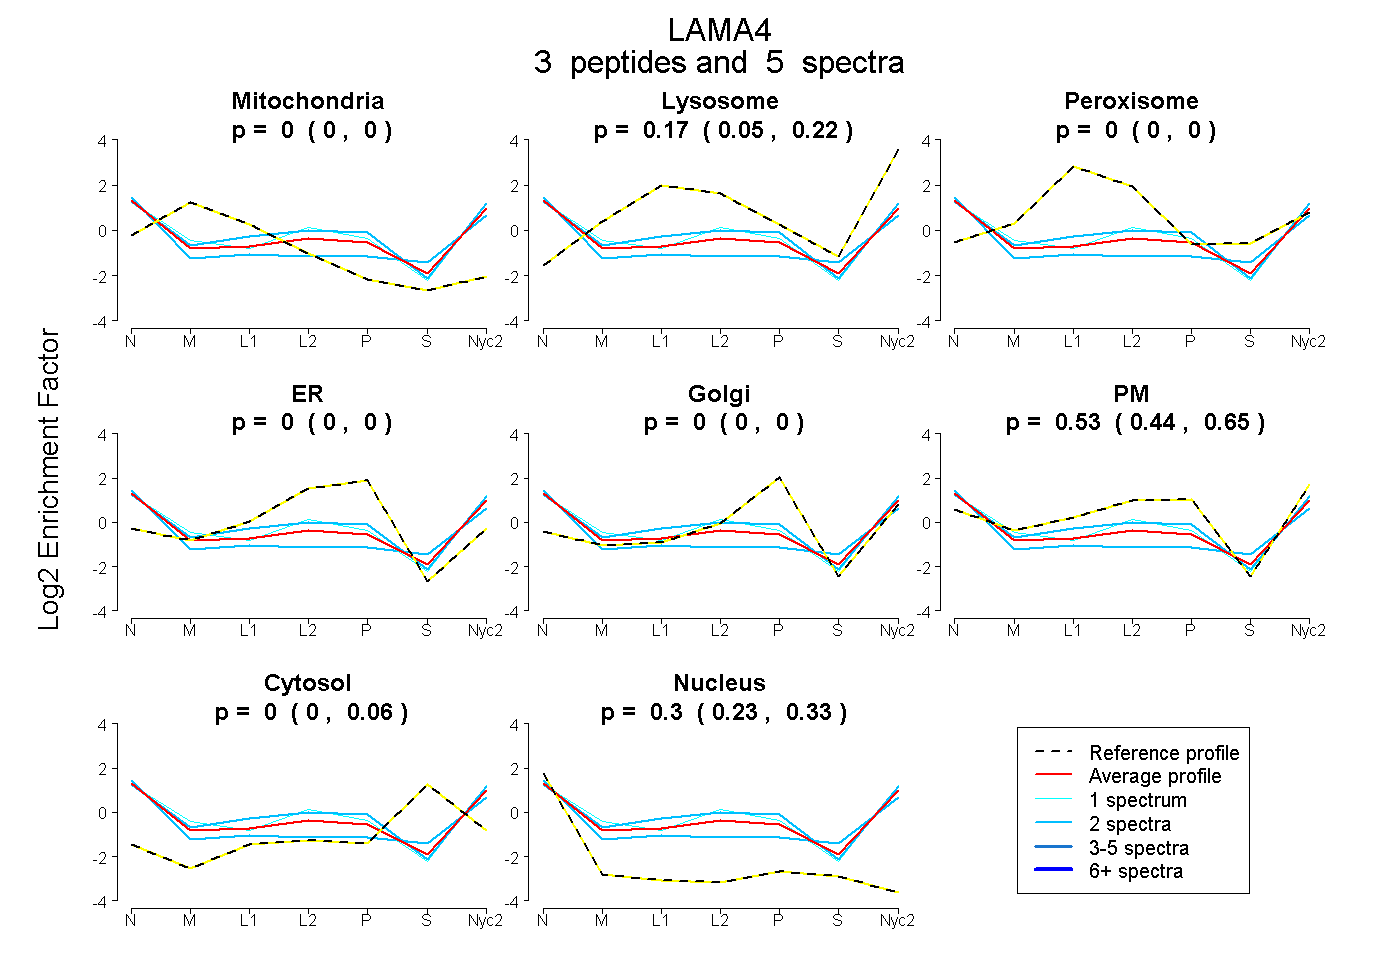
0.000 | 0.000
0.046 | 0.219
0.000 | 0.000
0.000 | 0.000
0.000 | 0.000
0.437 | 0.646
0.000 | 0.055
0.233 | 0.332
| Plot | Mito | Lyso | Perox | ER | Golgi | PM | Cytosol | Nucleus | |||||
| Expt A |
3 peptides |
5 spectra |
|
0.000 0.000 | 0.000 |
0.166 0.046 | 0.219 |
0.000 0.000 | 0.000 |
0.000 0.000 | 0.000 |
0.000 0.000 | 0.000 |
0.531 0.437 | 0.646 |
0.001 0.000 | 0.055 |
0.302 0.233 | 0.332 |
| 1 spectrum, LSDLQESINQALDHVR | 0.000 | 0.082 | 0.000 | 0.000 | 0.000 | 0.695 | 0.000 | 0.223 | ||
| 2 spectra, DFNLLEQK | 0.000 | 0.200 | 0.000 | 0.000 | 0.000 | 0.321 | 0.092 | 0.386 | ||
| 2 spectra, LTPSKPFTGCIR | 0.000 | 0.099 | 0.000 | 0.000 | 0.000 | 0.692 | 0.000 | 0.209 |
| Plot | Lyso | Other | |||||||||||
| Expt C |
1 peptide |
2 spectra |
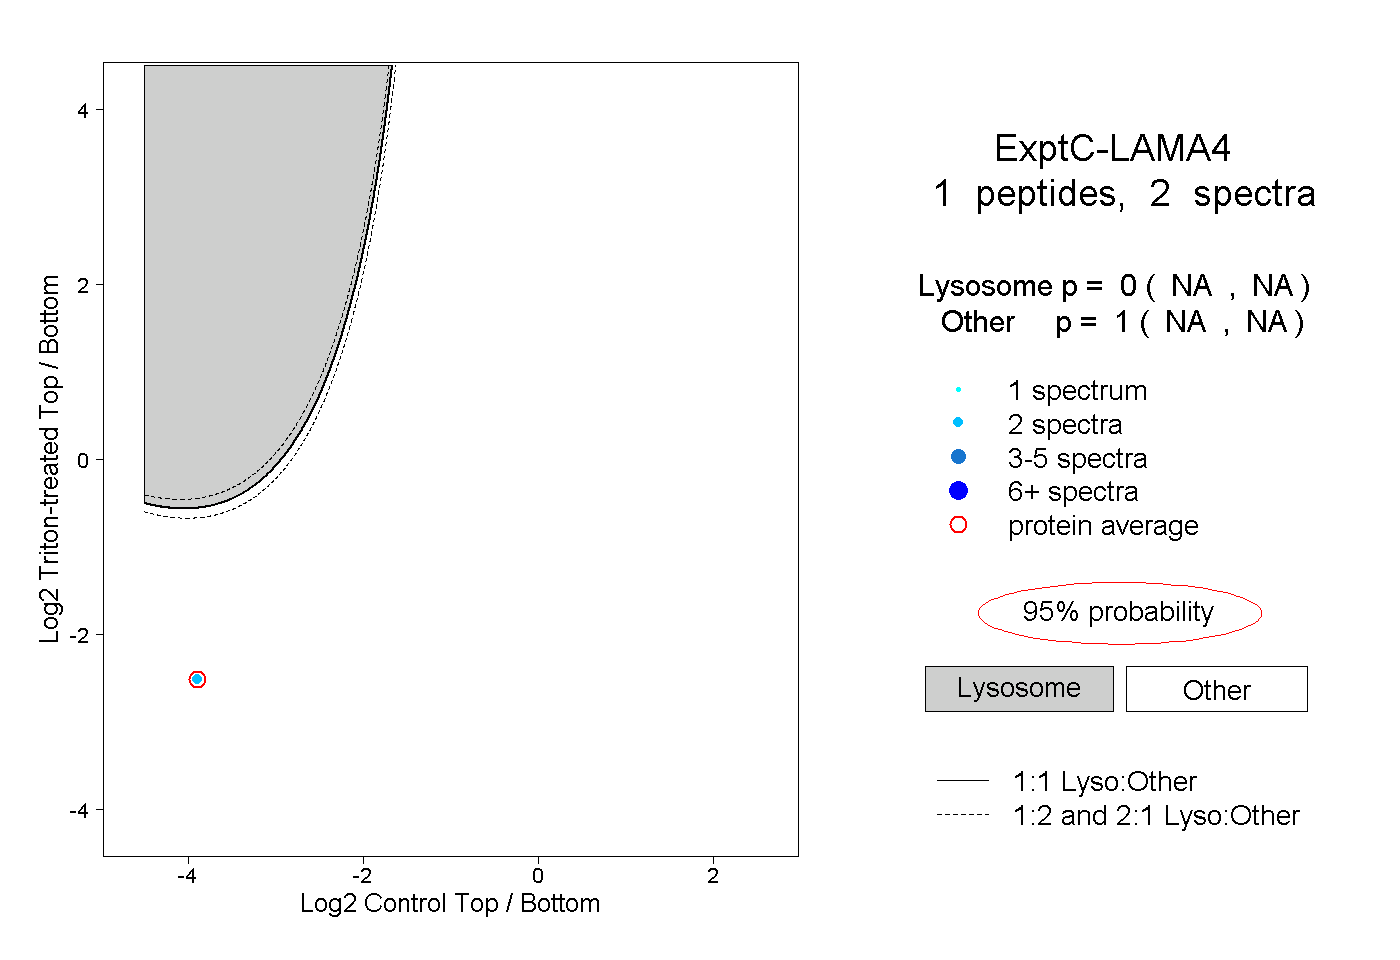 |
0.000 NA | NA |
1.000 NA | NA |