 2
2peptides
spectra
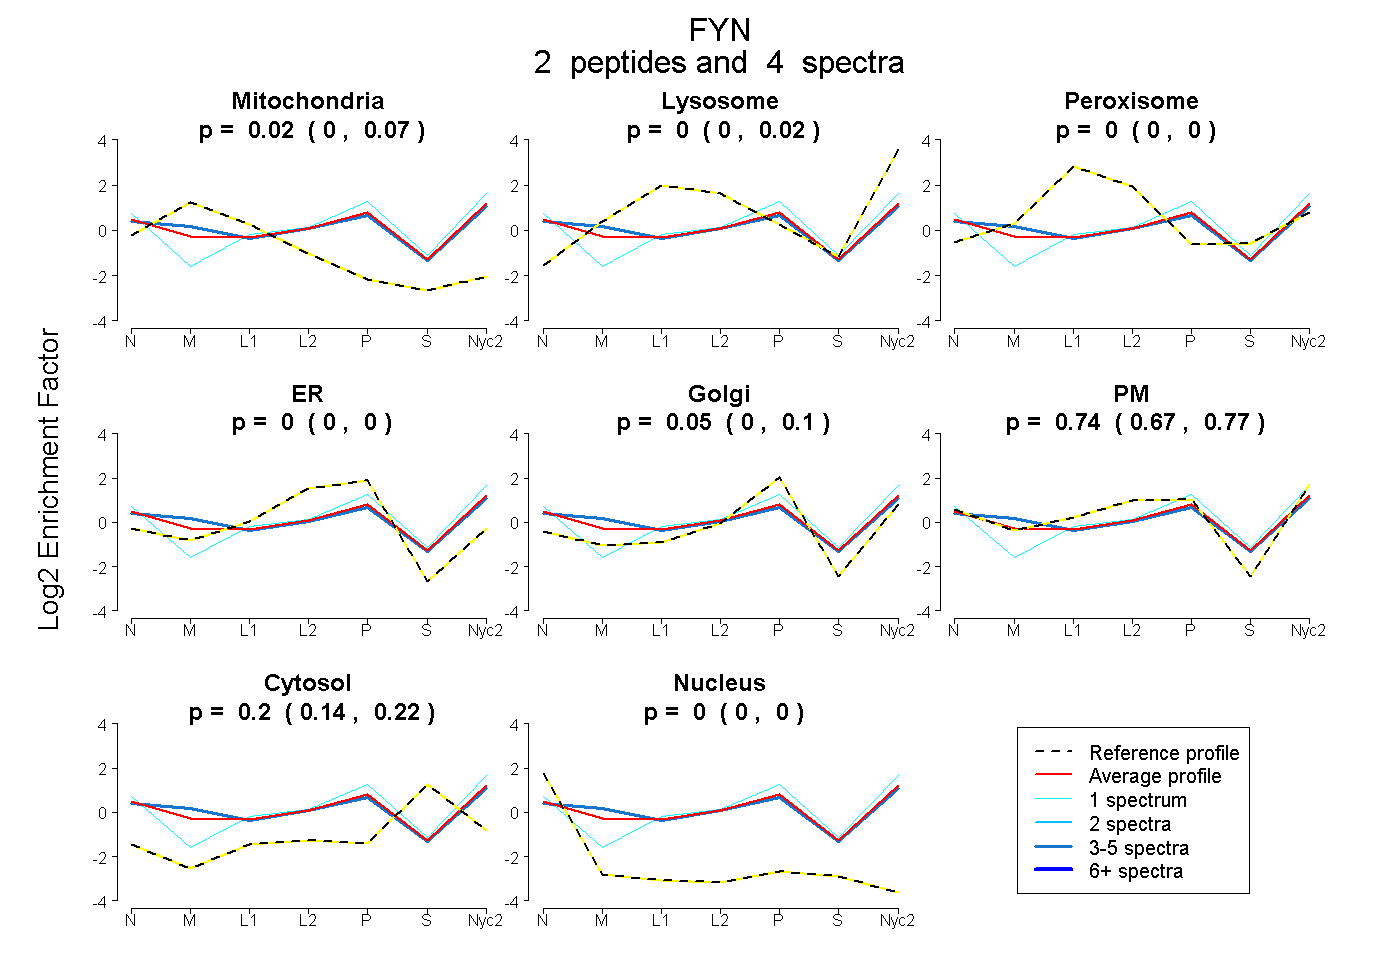
0.000 | 0.069
0.000 | 0.020
0.000 | 0.000
0.000 | 0.000
0.000 | 0.102
0.671 | 0.769
0.140 | 0.223
0.000 | 0.002
3peptides
spectra
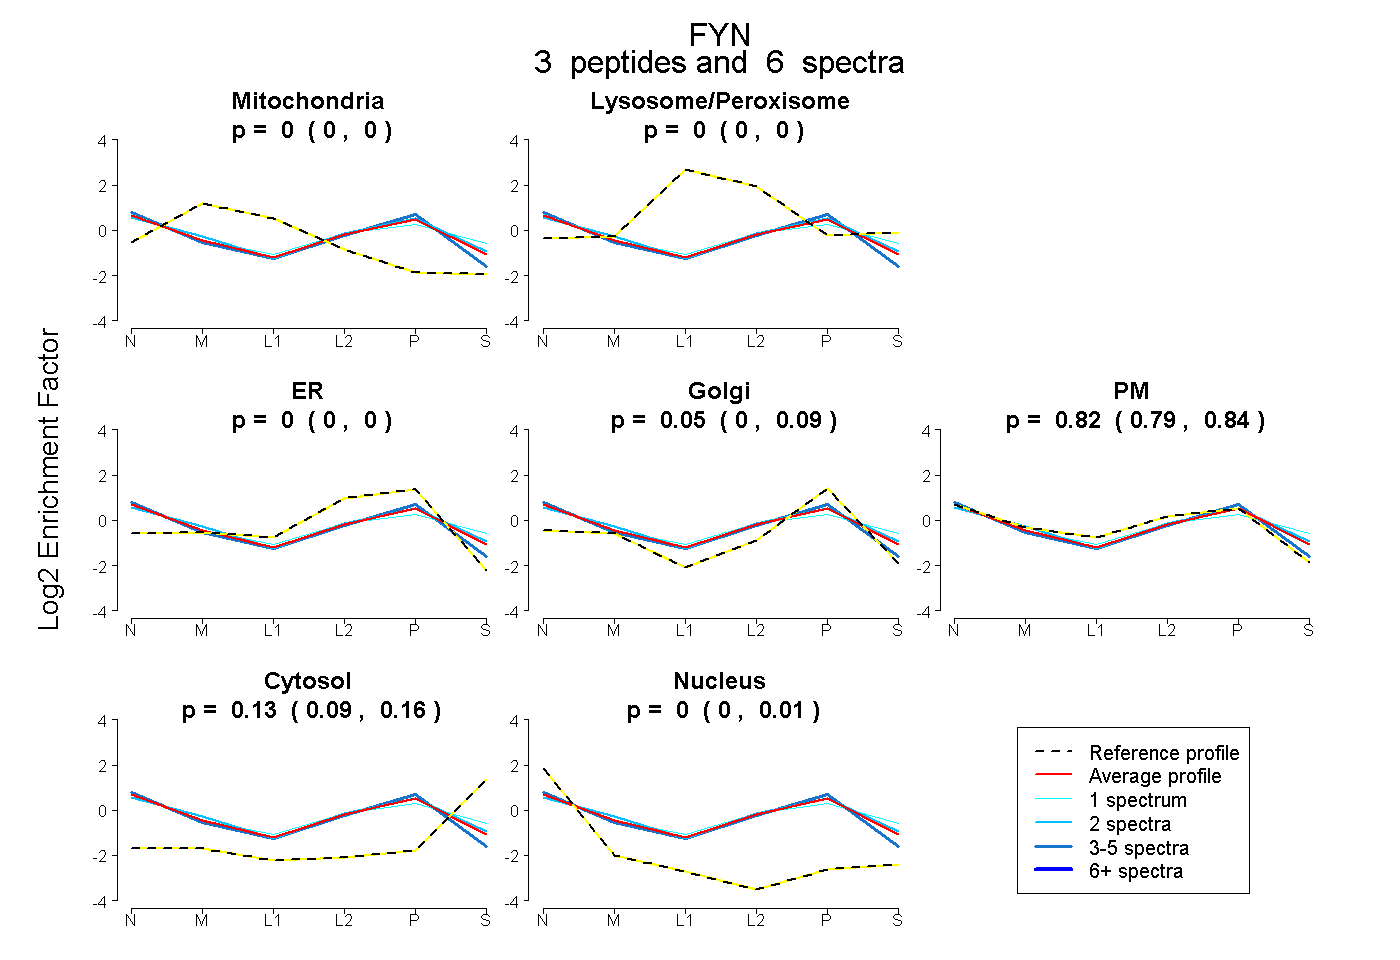
0.000 | 0.000
0.000 | 0.000
0.000 | 0.000
0.000 | 0.086
0.793 | 0.843
0.094 | 0.160
0.000 | 0.006
2peptides
spectra
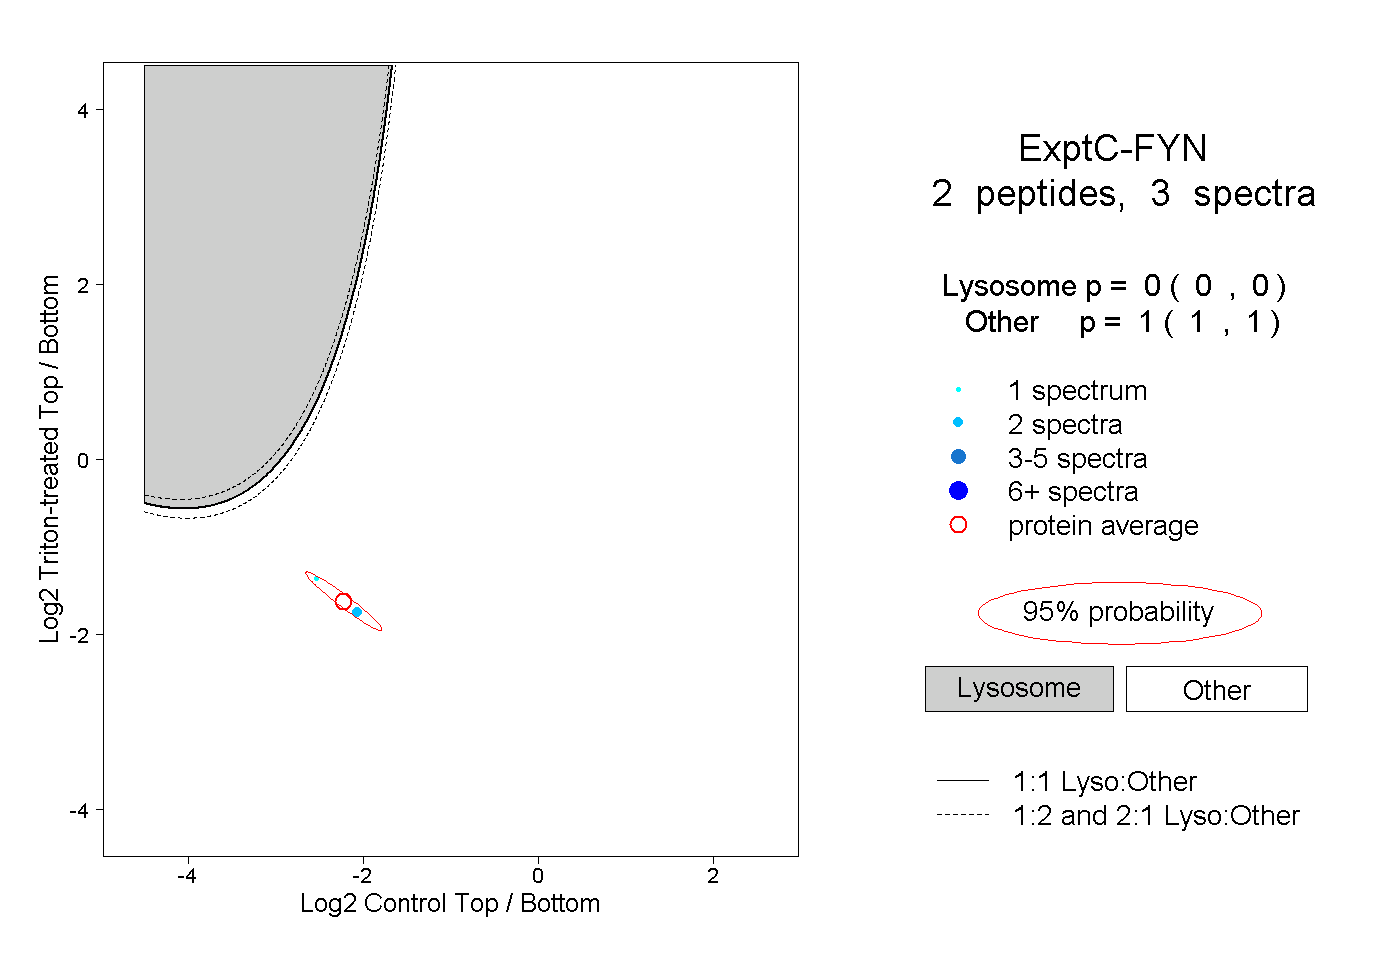
0.000 | 0.000
1.000 | 1.000
1peptide
spectra
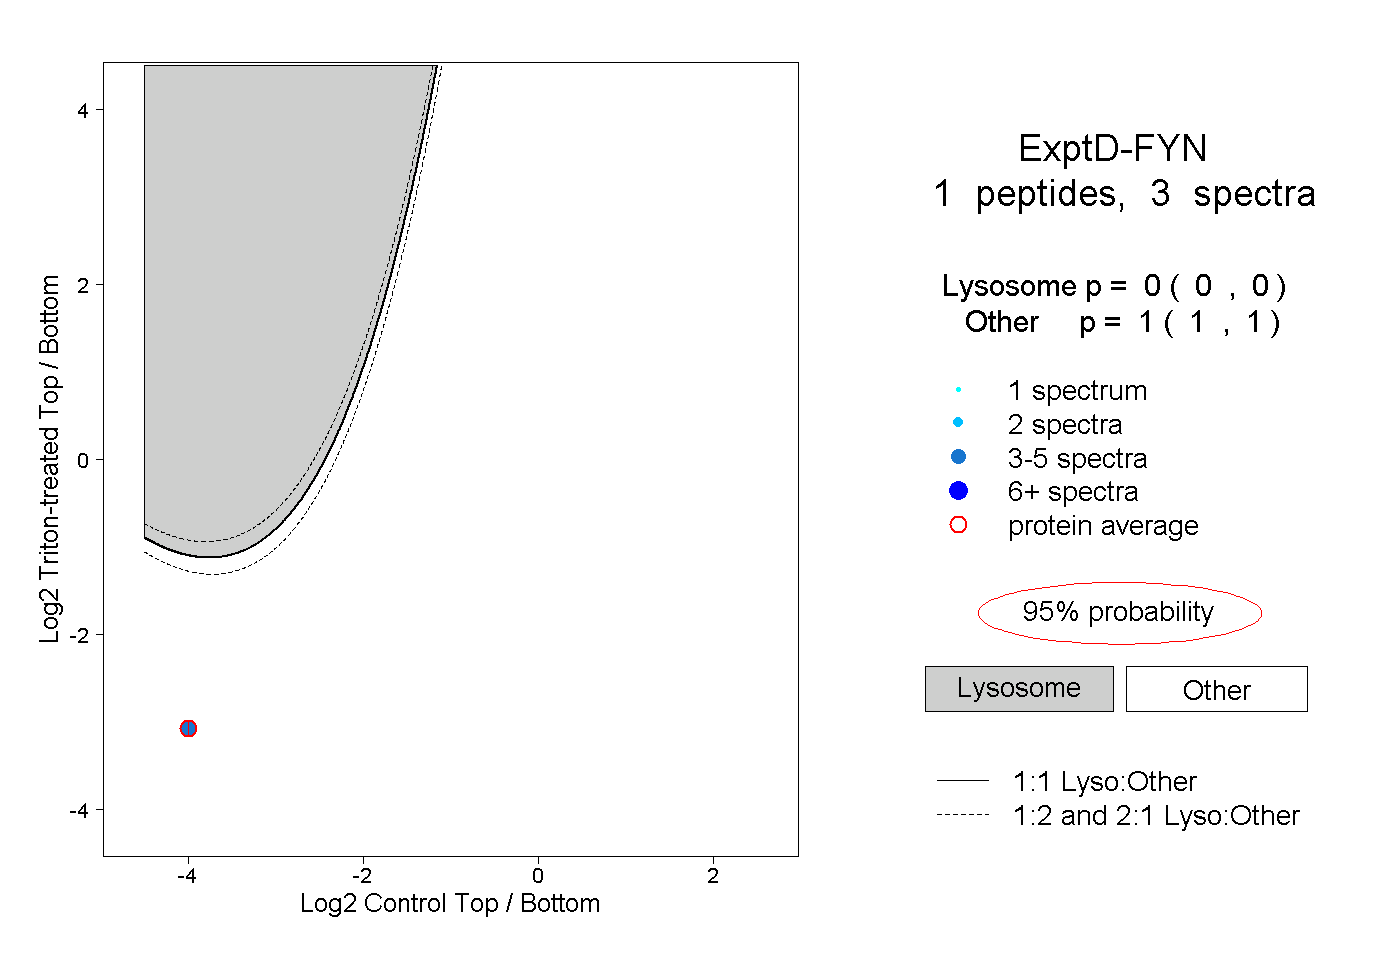
0.000 | 0.000
1.000 | 1.000