 2
2peptides
spectra
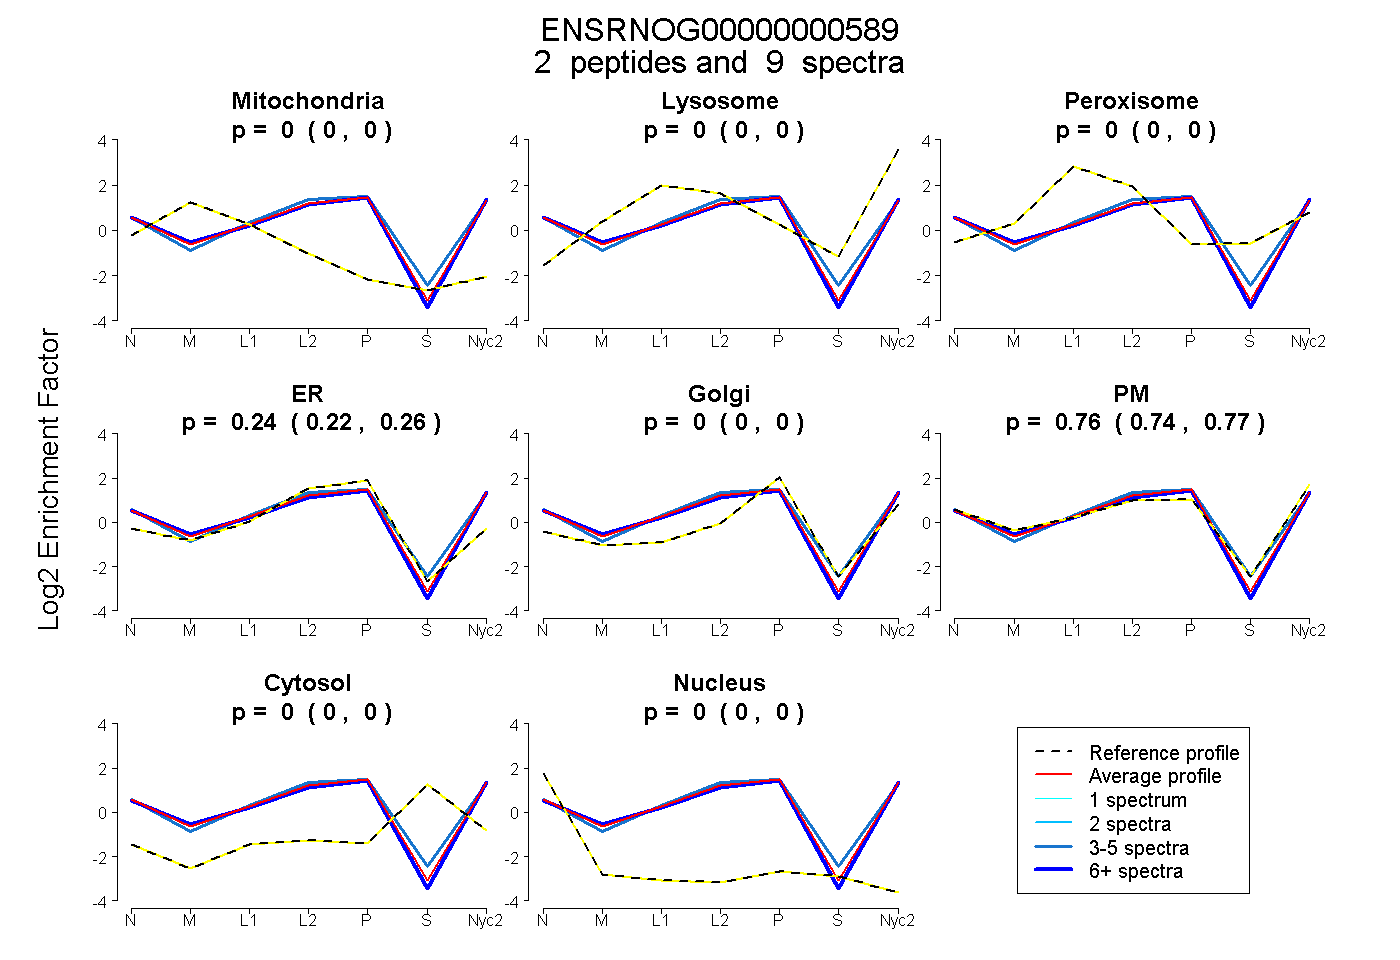
0.000 | 0.000
0.000 | 0.000
0.000 | 0.000
0.225 | 0.259
0.000 | 0.000
0.738 | 0.771
0.000 | 0.000
0.000 | 0.000
1peptide
spectrum
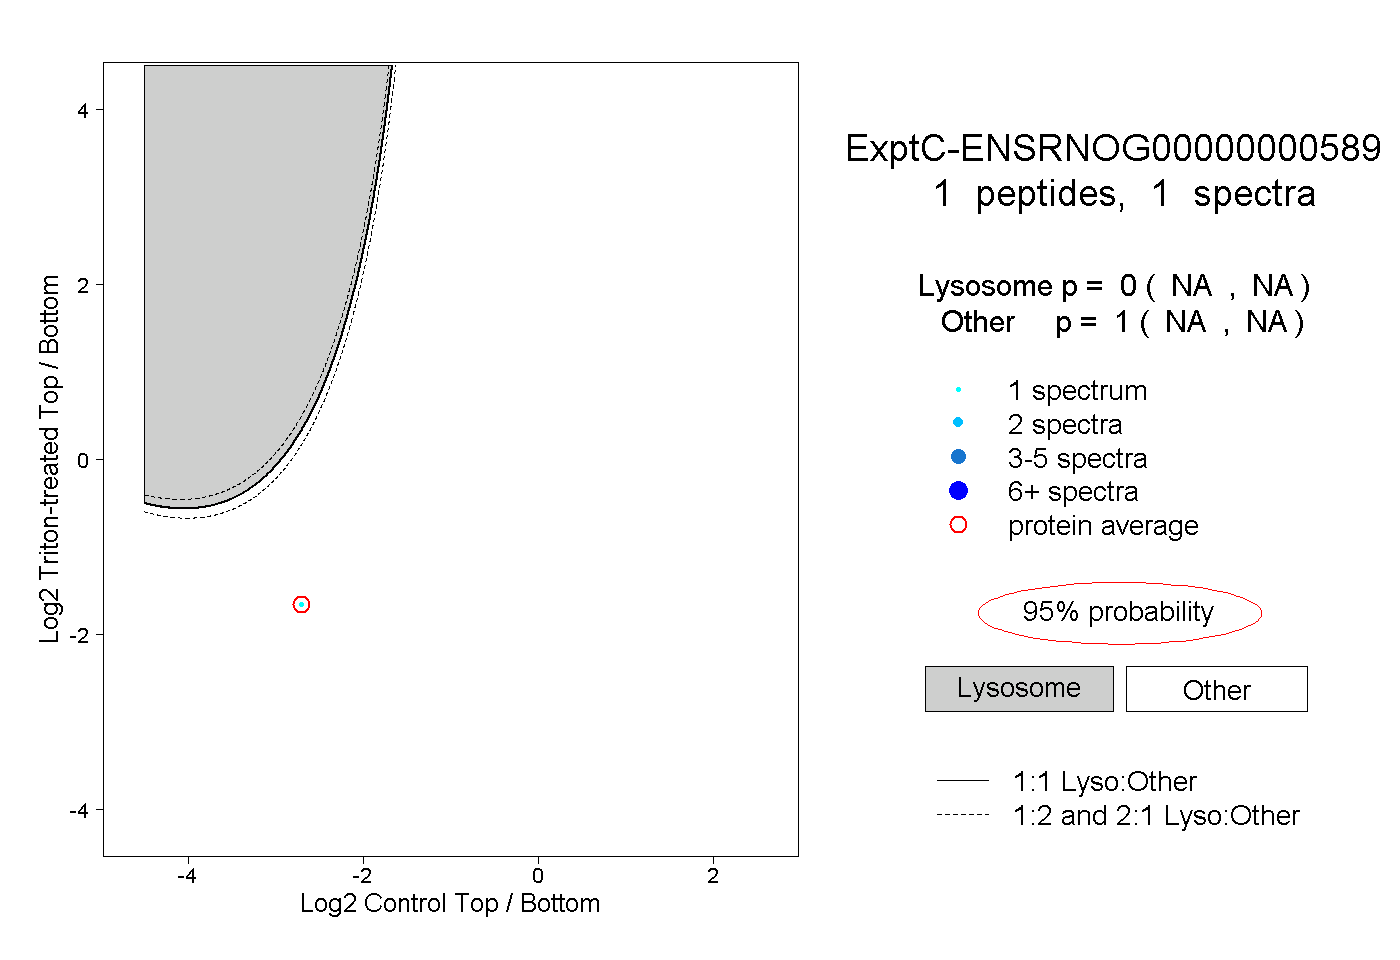
NA | NA
NA | NA
1peptide
spectra
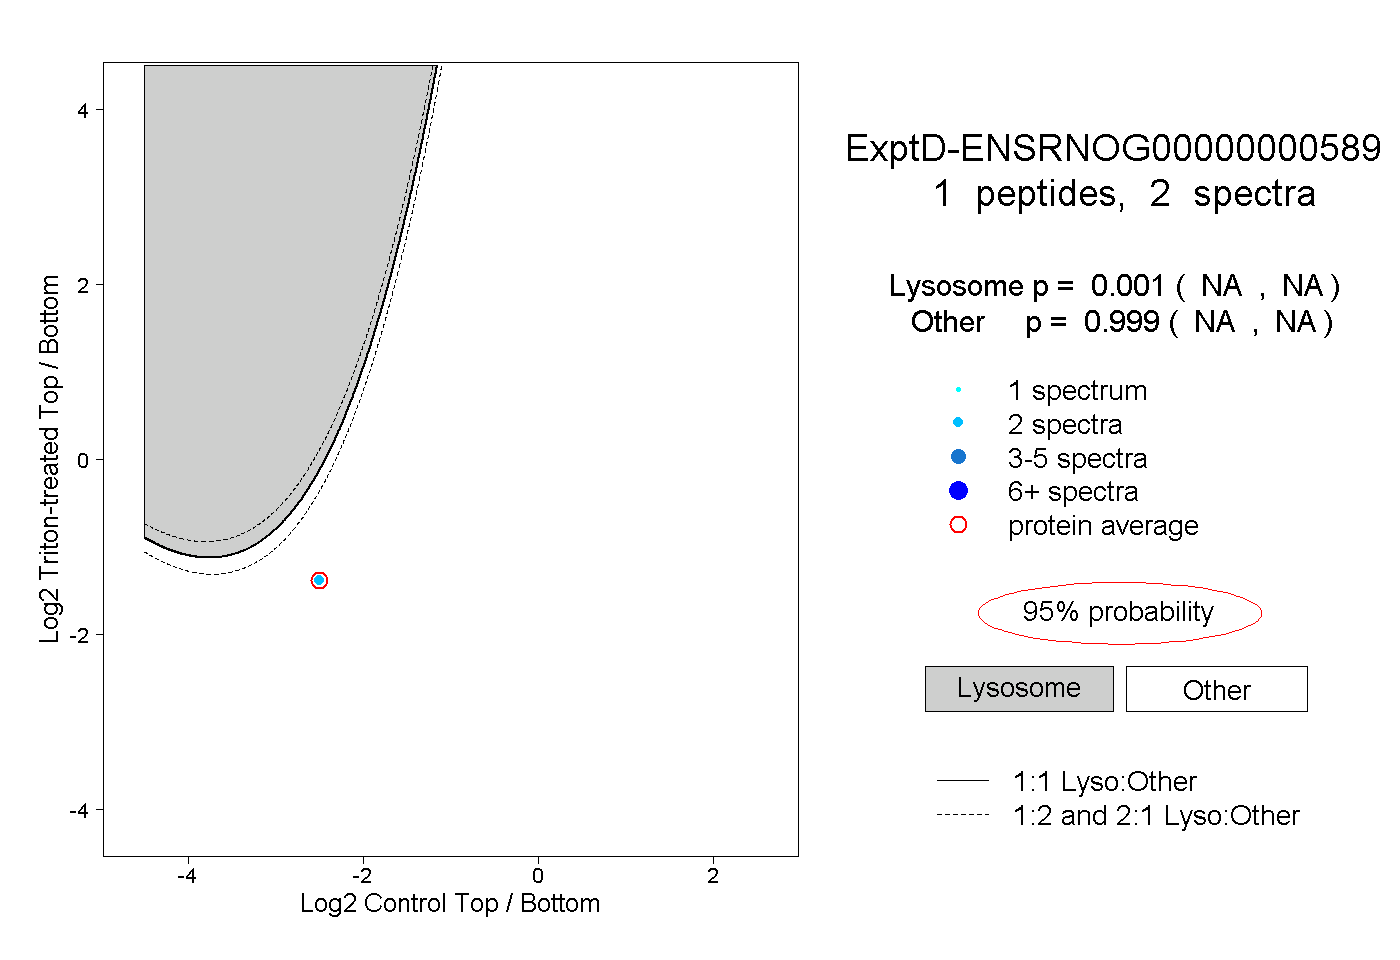
NA | NA
NA | NA