 6
6peptides
spectra
0.000 | 0.000
0.000 | 0.000
0.000 | 0.000
0.293 | 0.327
0.000 | 0.000
0.000 | 0.000
0.090 | 0.130
0.560 | 0.591
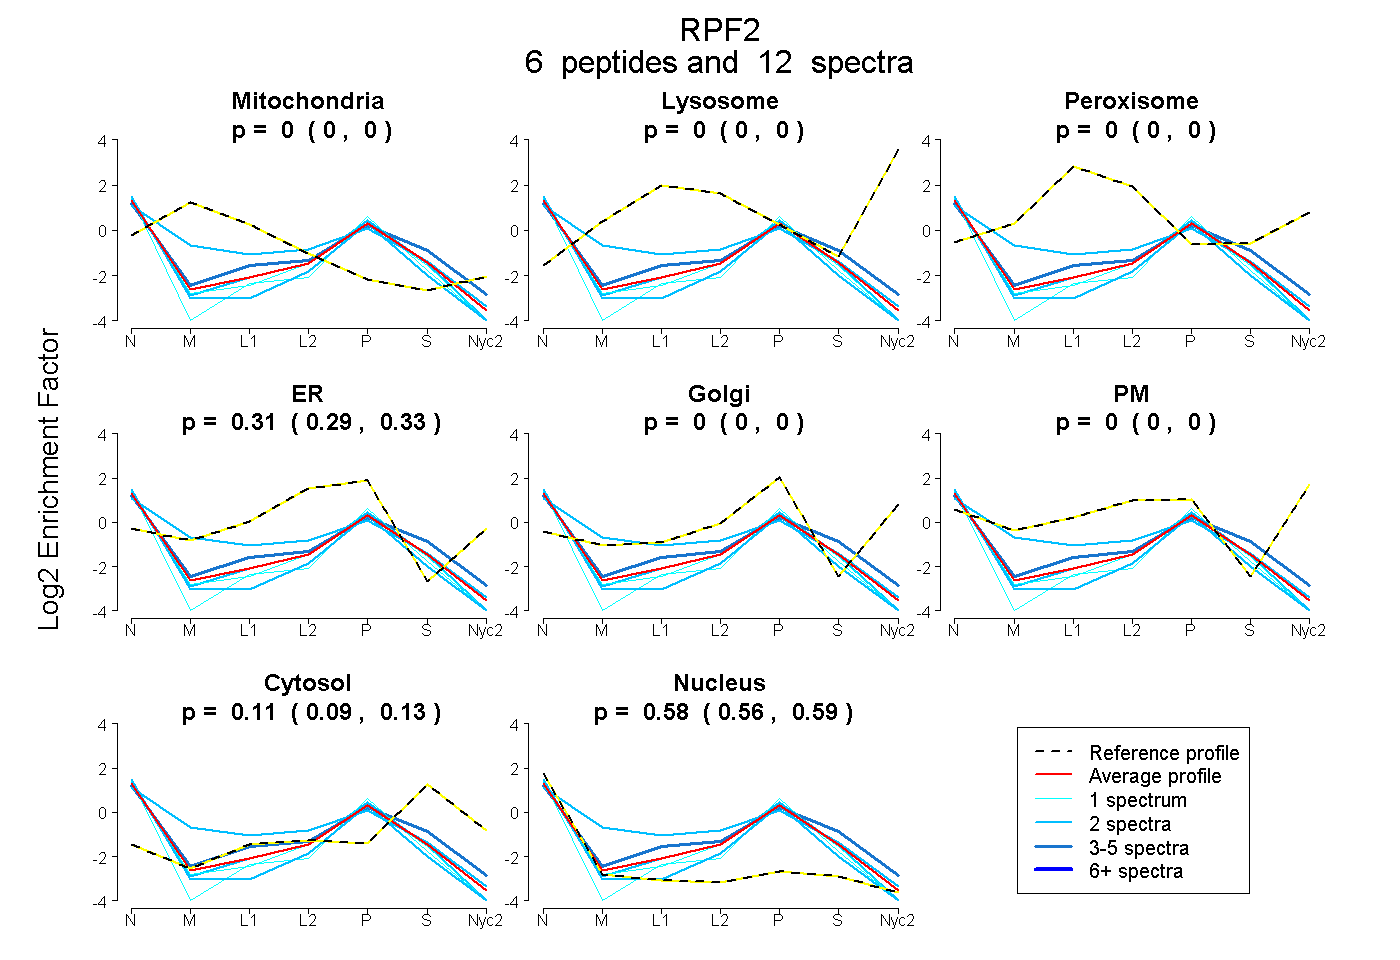
| Plot | Mito | Lyso | Perox | ER | Golgi | PM | Cytosol | Nucleus | |||||
| Expt A |
6 peptides |
12 spectra |
|
0.000 0.000 | 0.000 |
0.000 0.000 | 0.000 |
0.000 0.000 | 0.000 |
0.311 0.293 | 0.327 |
0.000 0.000 | 0.000 |
0.000 0.000 | 0.000 |
0.111 0.090 | 0.130 |
0.578 0.560 | 0.591 |
| 4 spectra, GPTVSNVR | 0.000 | 0.000 | 0.000 | 0.310 | 0.000 | 0.000 | 0.242 | 0.448 | ||
| 1 spectrum, NISQDTFGTTFGR | 0.000 | 0.000 | 0.000 | 0.235 | 0.000 | 0.000 | 0.069 | 0.697 | ||
| 2 spectra, DVYALK | 0.000 | 0.000 | 0.000 | 0.303 | 0.000 | 0.000 | 0.081 | 0.616 | ||
| 1 spectrum, GGNANATVTQVLR | 0.000 | 0.000 | 0.000 | 0.289 | 0.000 | 0.000 | 0.069 | 0.642 | ||
| 2 spectra, NLLIDFFR | 0.000 | 0.000 | 0.000 | 0.261 | 0.000 | 0.000 | 0.002 | 0.737 | ||
| 2 spectra, RPNNLVIGR | 0.193 | 0.000 | 0.000 | 0.365 | 0.000 | 0.000 | 0.064 | 0.378 |
| Plot | Mito | Lyso or Perox | ER | Golgi | PM | Cytosol | Nucleus | ||||||
| Expt B |
1 peptide |
1 spectrum |
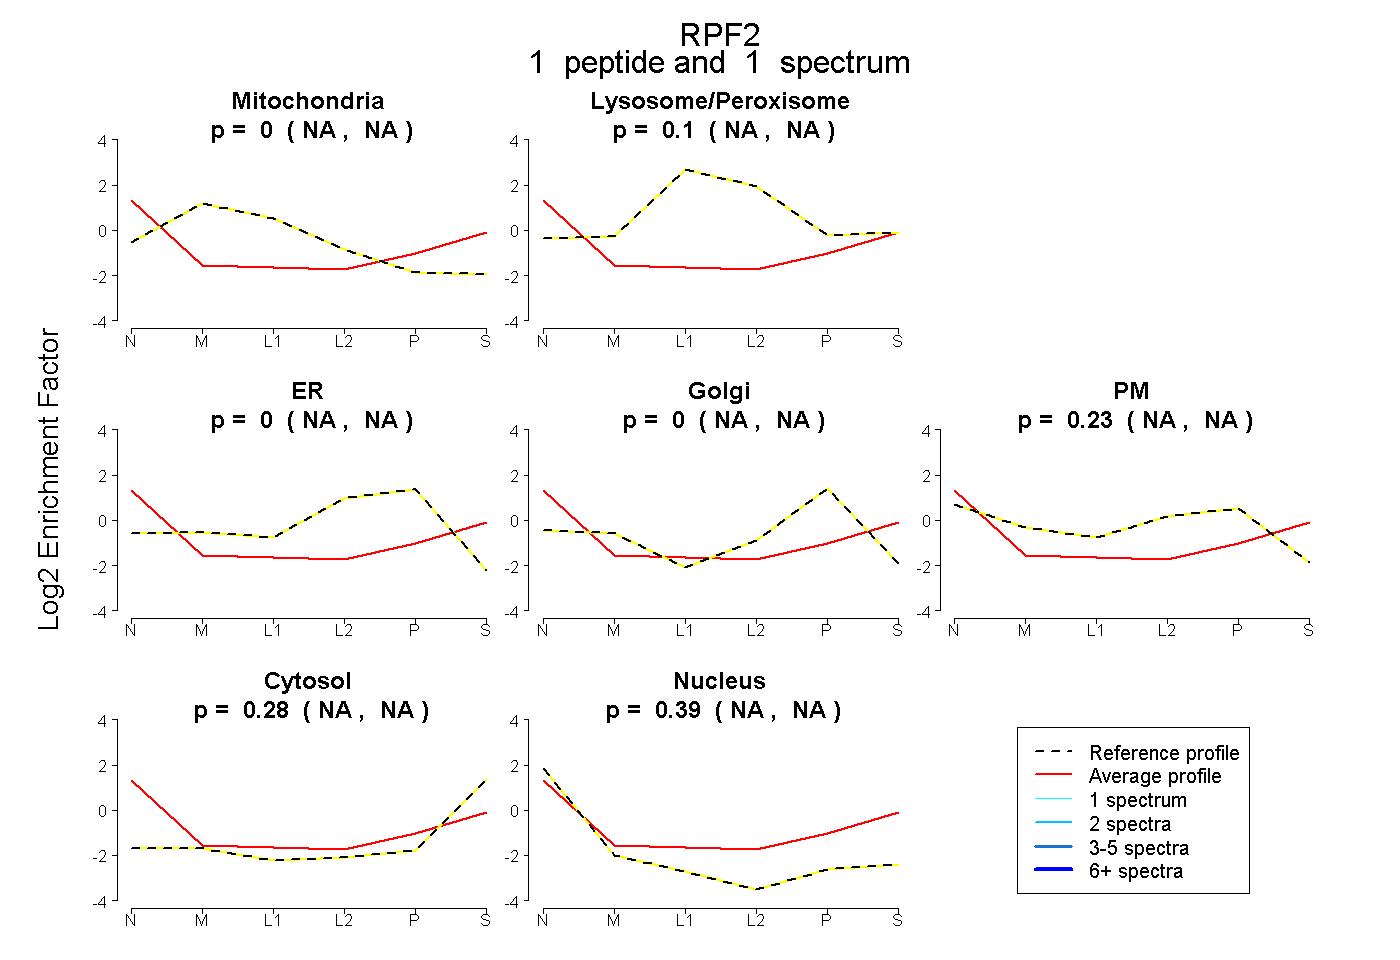 |
0.000 NA | NA |
0.100 NA | NA |
0.000 NA | NA |
0.000 NA | NA |
0.228 NA | NA |
0.285 NA | NA |
0.387 NA | NA |
|||
| Plot | Lyso | Other | |||||||||||
| Expt C |
1 peptide |
1 spectrum |
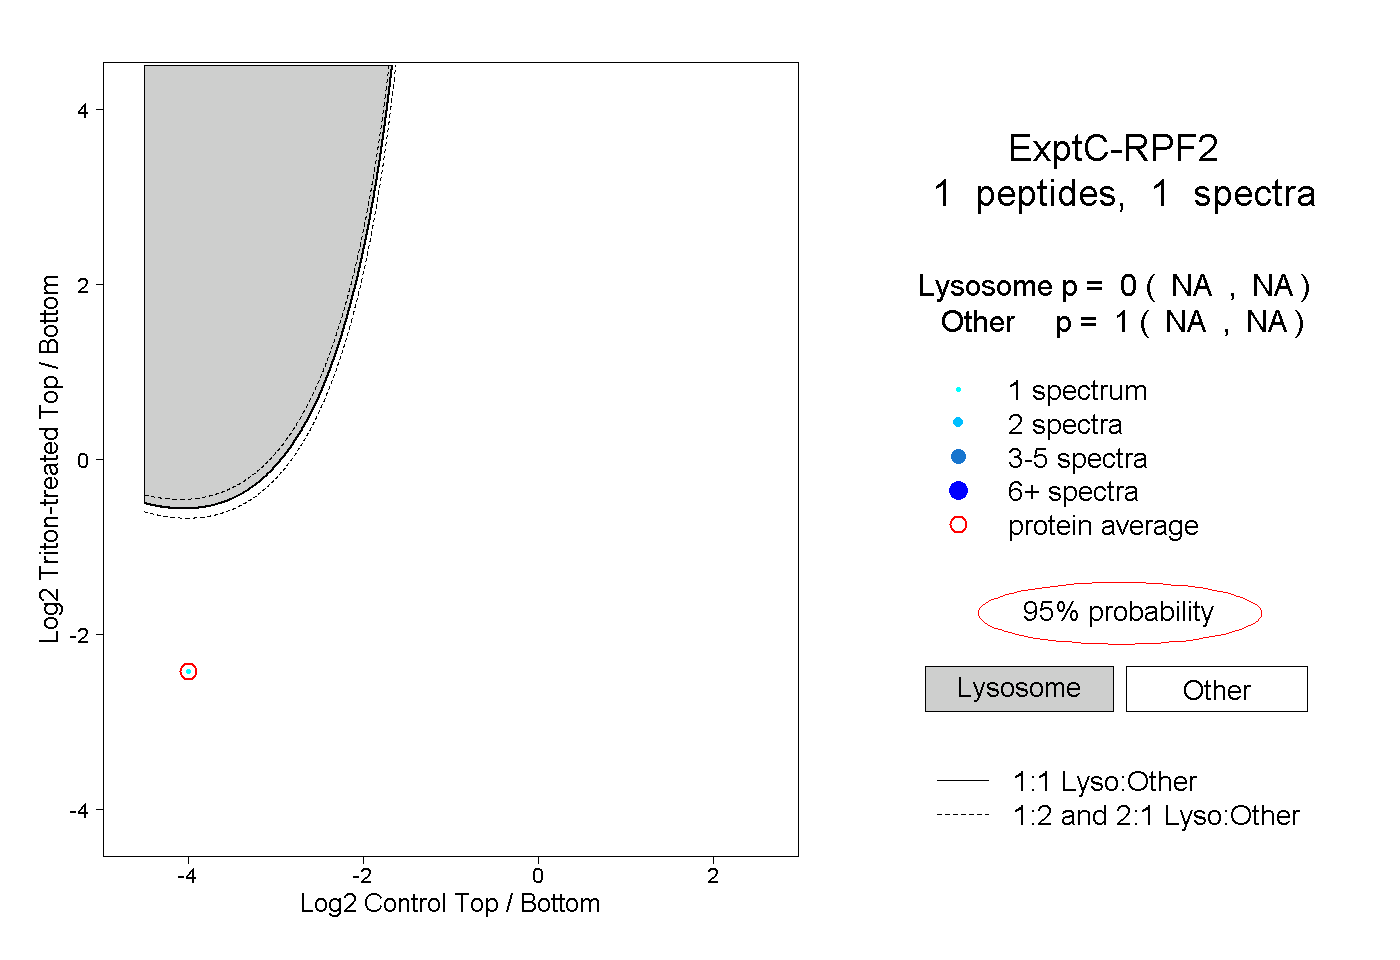 |
0.000 NA | NA |
1.000 NA | NA |