 4
4peptides
spectra
0.000 | 0.000
0.000 | 0.000
0.000 | 0.053
0.283 | 0.465
0.000 | 0.097
0.065 | 0.224
0.384 | 0.437
0.000 | 0.024
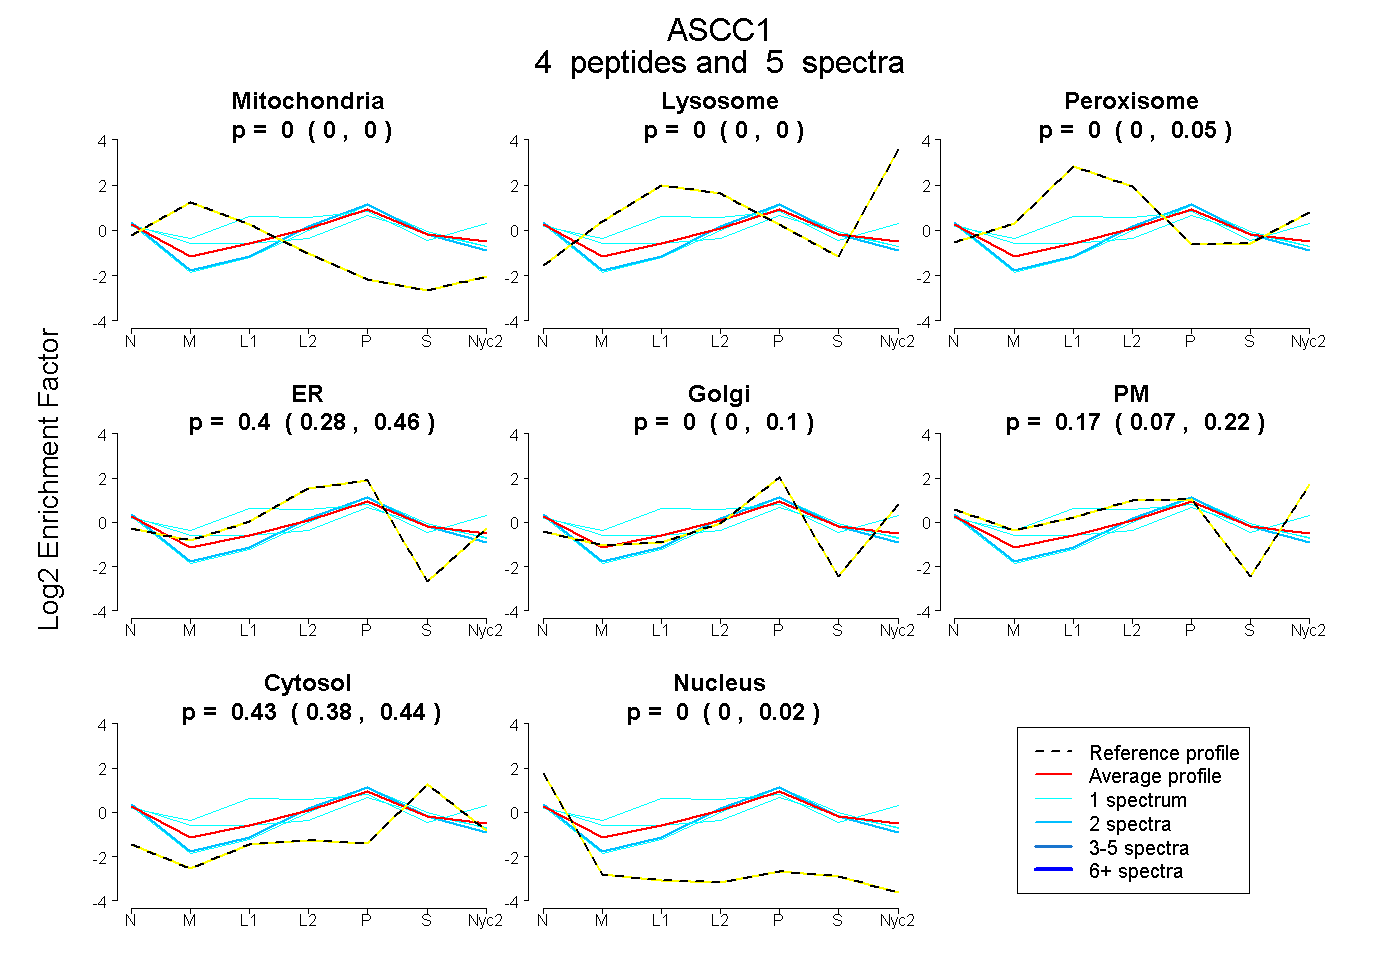
| Plot | Mito | Lyso | Perox | ER | Golgi | PM | Cytosol | Nucleus | |||||
| Expt A |
4 peptides |
5 spectra |
|
0.000 0.000 | 0.000 |
0.000 0.000 | 0.000 |
0.000 0.000 | 0.053 |
0.400 0.283 | 0.465 |
0.000 0.000 | 0.097 |
0.171 0.065 | 0.224 |
0.426 0.384 | 0.437 |
0.003 0.000 | 0.024 |
| 2 spectra, LQELVDR | 0.000 | 0.000 | 0.000 | 0.462 | 0.073 | 0.000 | 0.418 | 0.047 | ||
| 1 spectrum, YNLYTADGK | 0.000 | 0.000 | 0.365 | 0.078 | 0.226 | 0.148 | 0.182 | 0.000 | ||
| 1 spectrum, TSINIPK | 0.108 | 0.000 | 0.019 | 0.233 | 0.107 | 0.133 | 0.399 | 0.002 | ||
| 1 spectrum, IDVLLDTFR | 0.000 | 0.000 | 0.000 | 0.343 | 0.178 | 0.000 | 0.451 | 0.028 |
| Plot | Mito | Lyso or Perox | ER | Golgi | PM | Cytosol | Nucleus | ||||||
| Expt B |
2 peptides |
3 spectra |
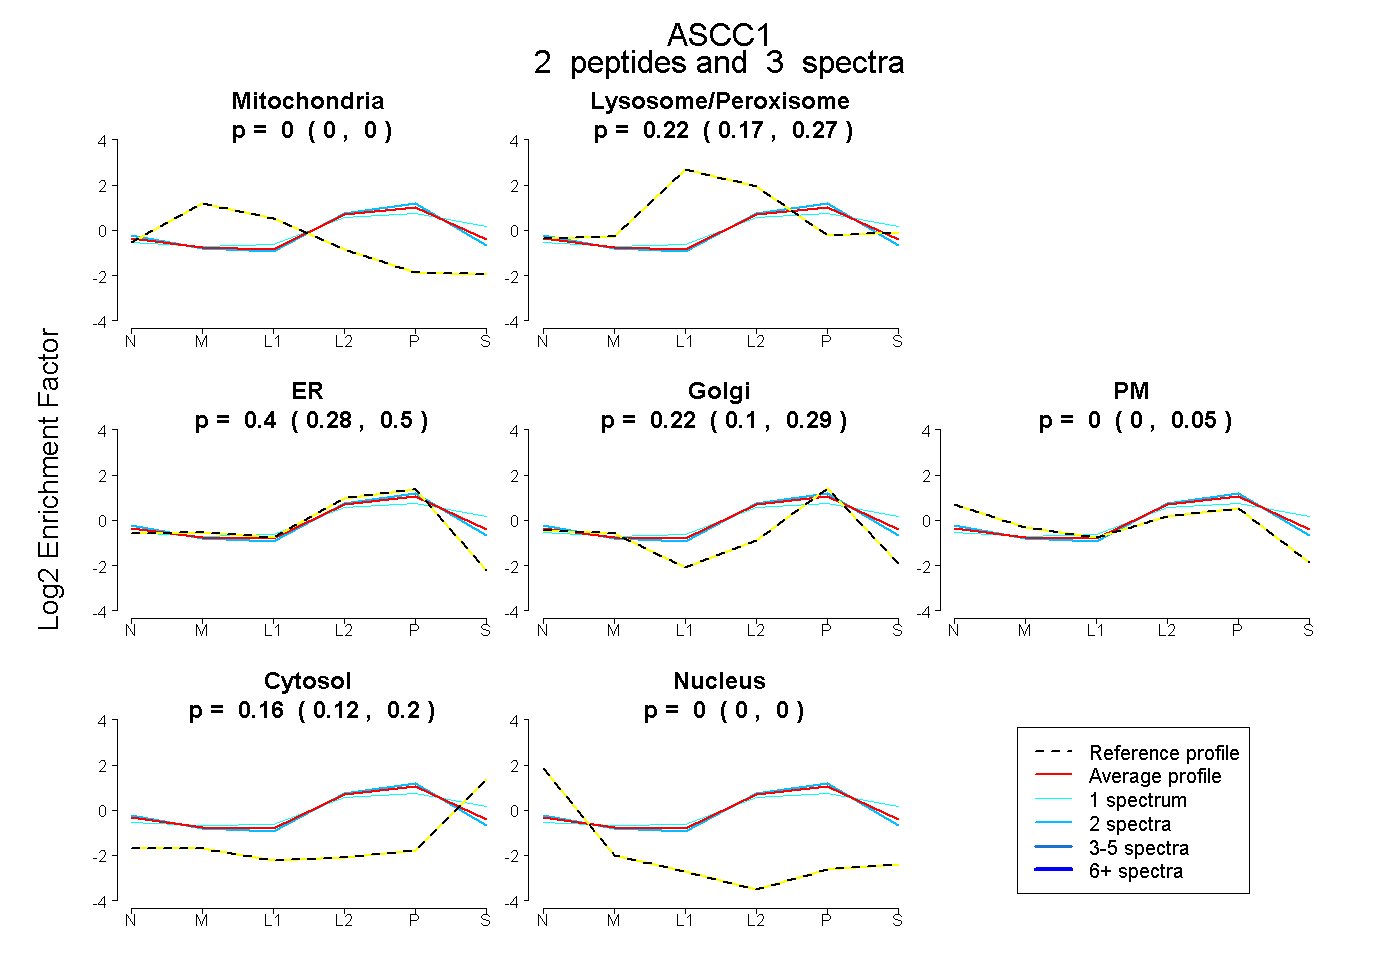 |
0.000 0.000 | 0.000 |
0.224 0.165 | 0.267 |
0.401 0.283 | 0.496 |
0.216 0.104 | 0.291 |
0.000 0.000 | 0.046 |
0.159 0.118 | 0.197 |
0.000 0.000 | 0.000 |
|||
| Plot | Lyso | Other | |||||||||||
| Expt C |
6 peptides |
13 spectra |
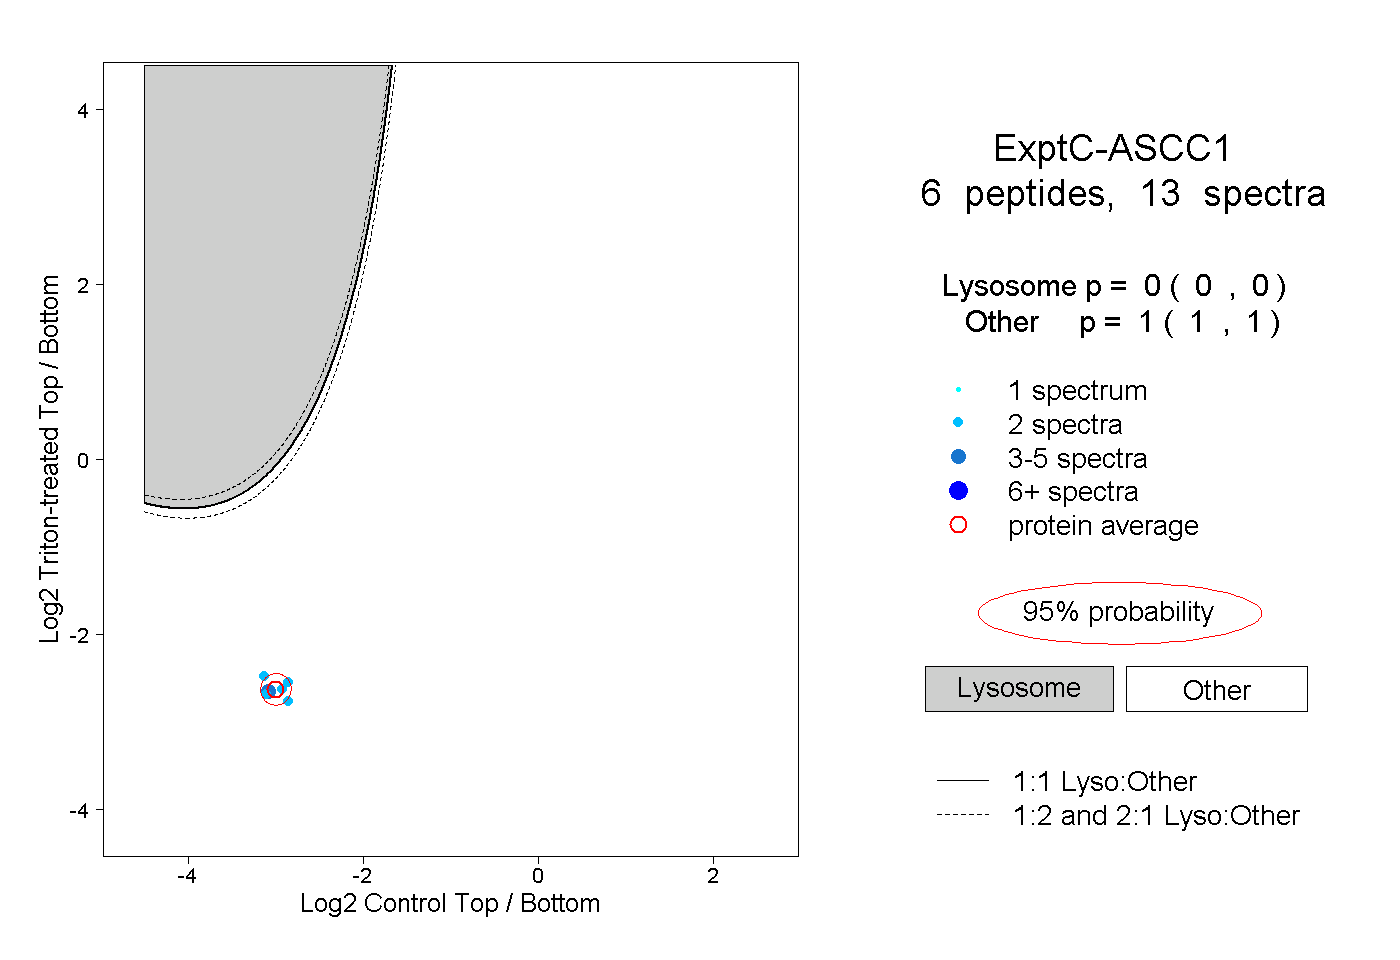 |
0.000 0.000 | 0.000 |
1.000 1.000 | 1.000 |
||||||||
| Plot | Lyso | Other | |||||||||||
| Expt D |
1 peptide |
1 spectrum |
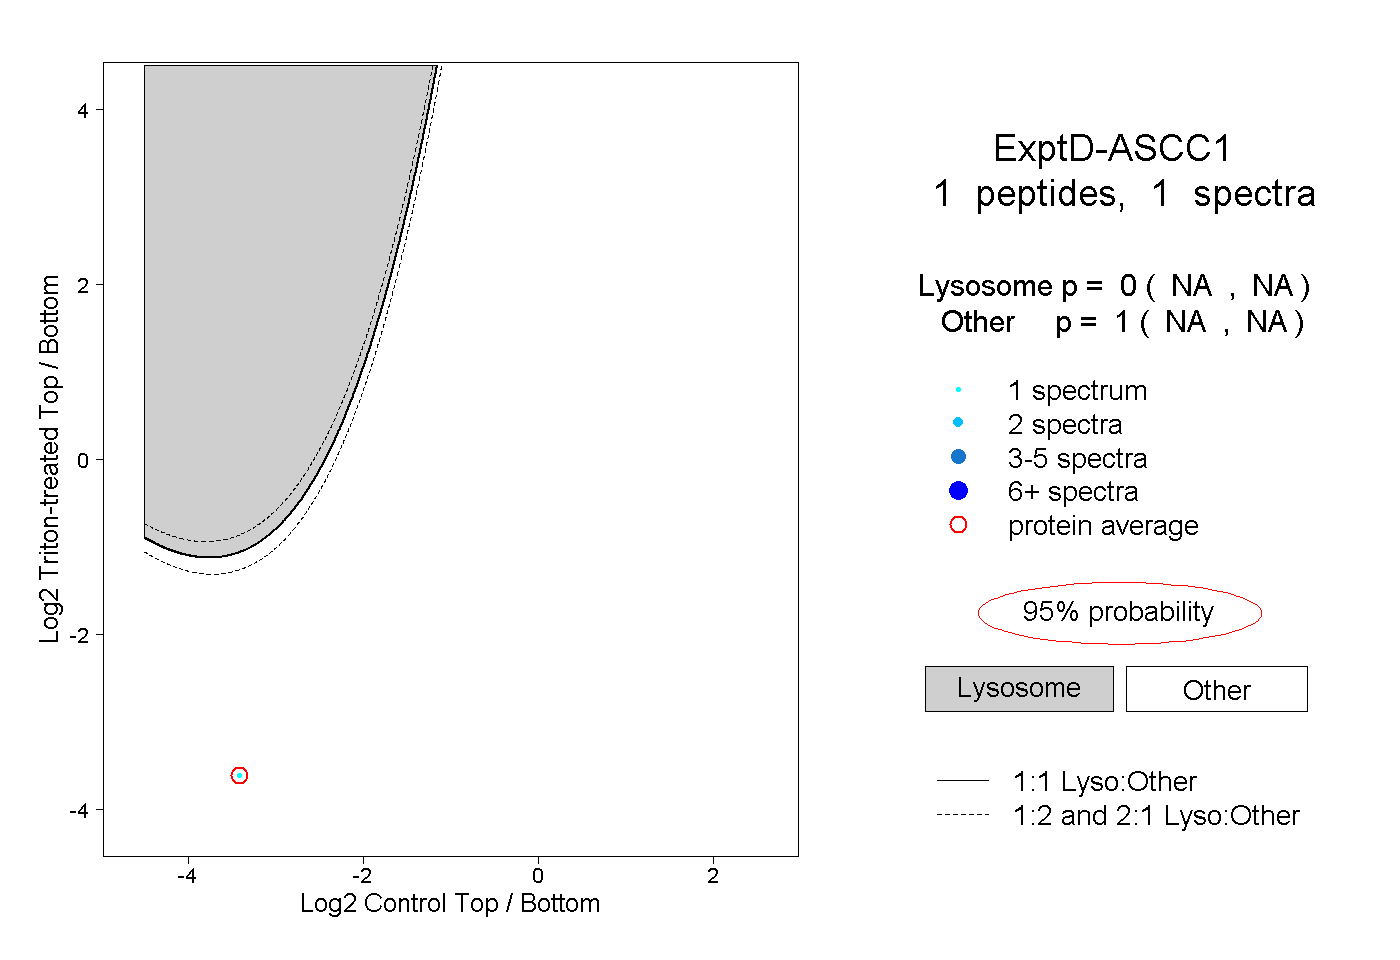 |
0.000 NA | NA |
1.000 NA | NA |