 19
19peptides
spectra
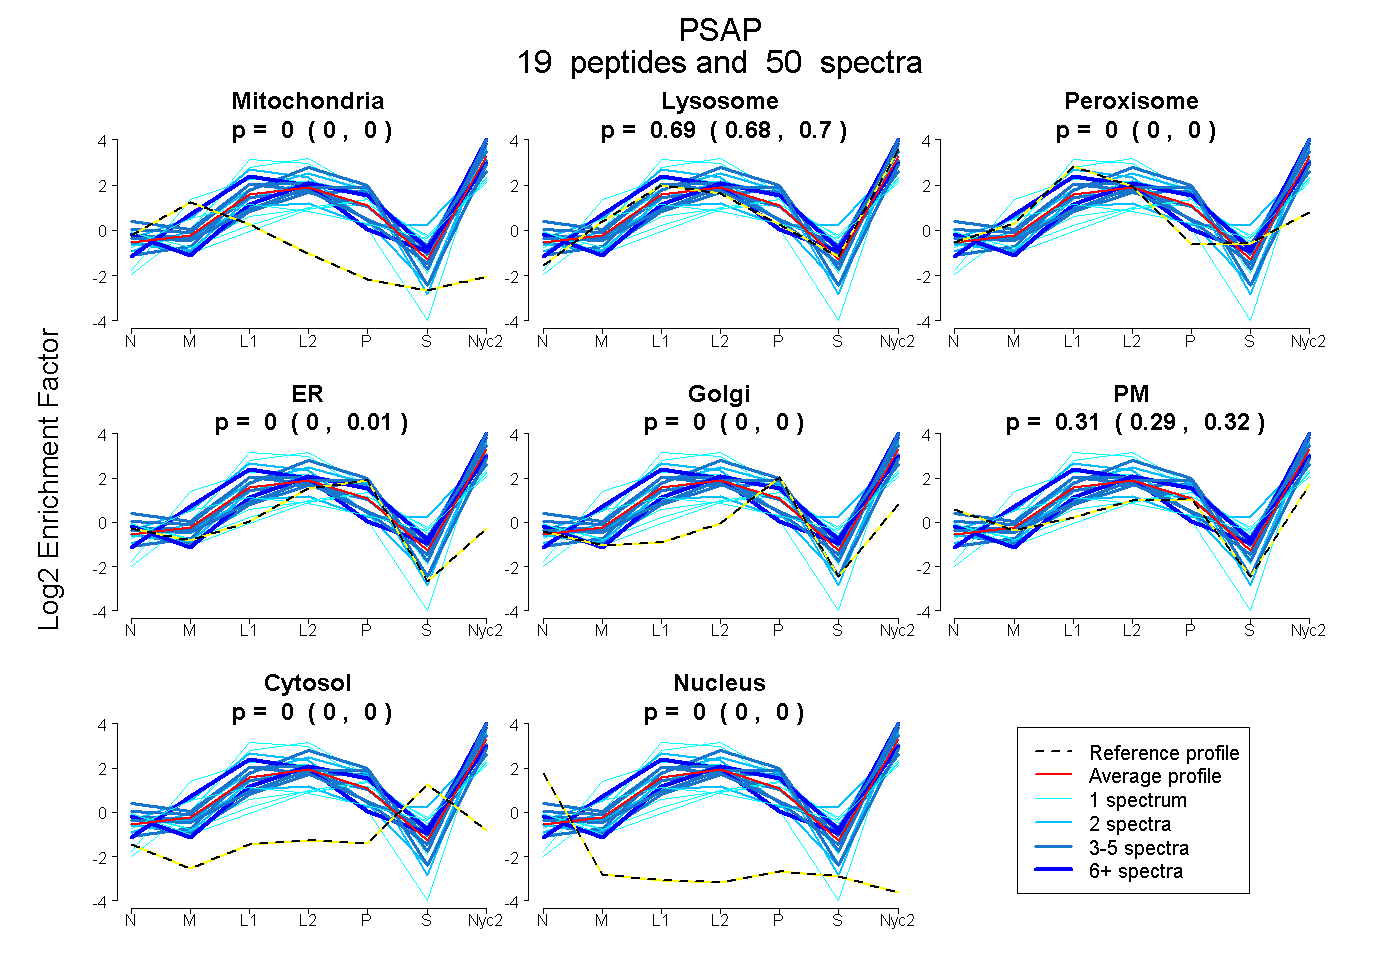
0.000 | 0.000
0.682 | 0.703
0.000 | 0.000
0.000 | 0.010
0.000 | 0.000
0.290 | 0.316
0.000 | 0.000
0.000 | 0.000
10peptides
spectra
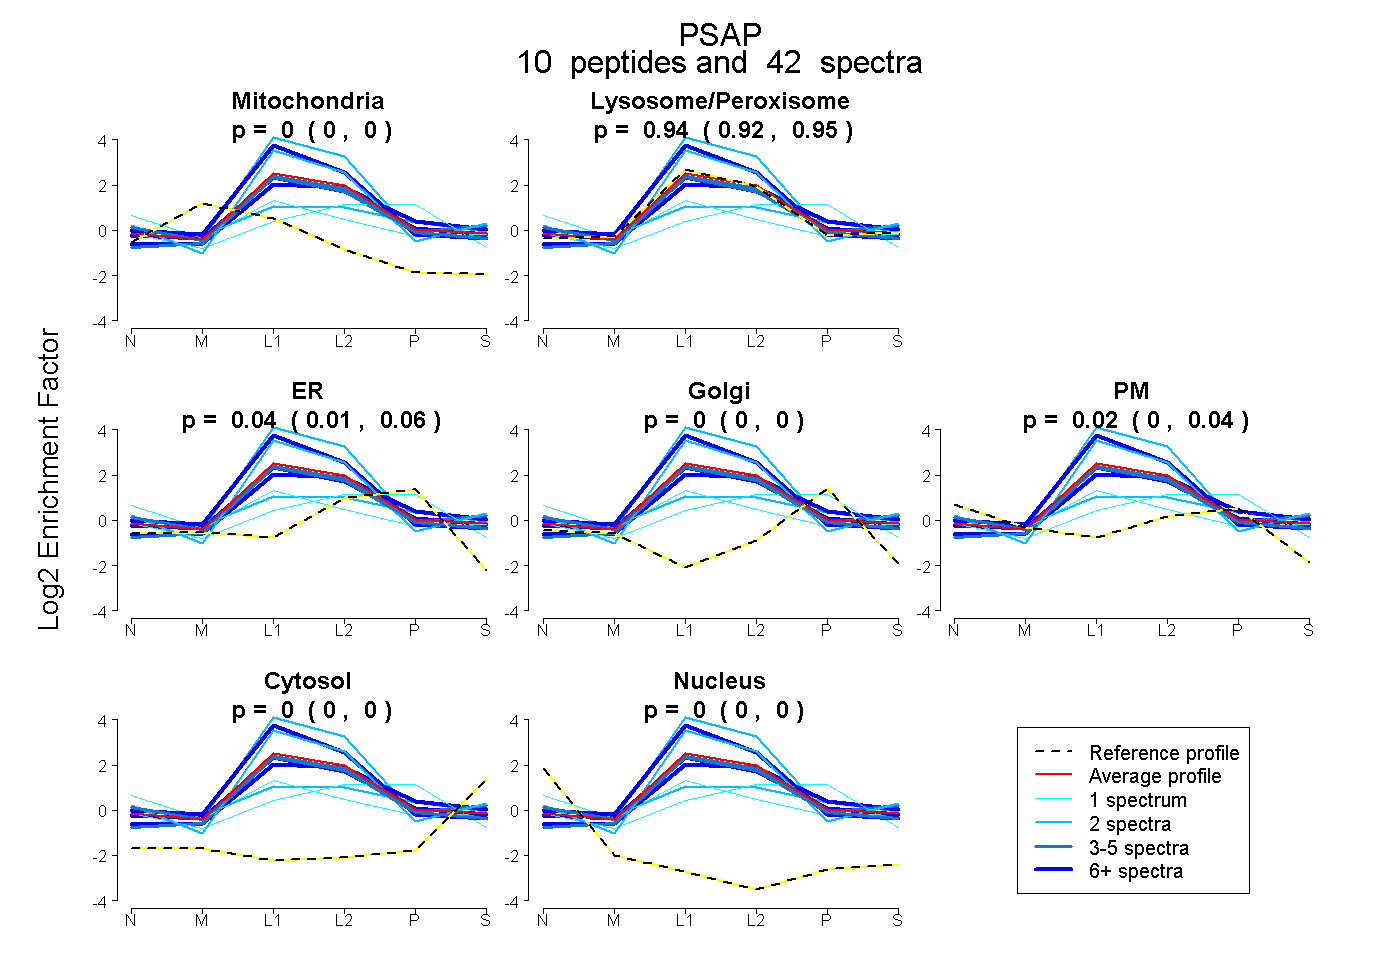
0.000 | 0.000
0.921 | 0.955
0.014 | 0.059
0.000 | 0.000
0.000 | 0.042
0.000 | 0.000
0.000 | 0.000
24peptides
spectra
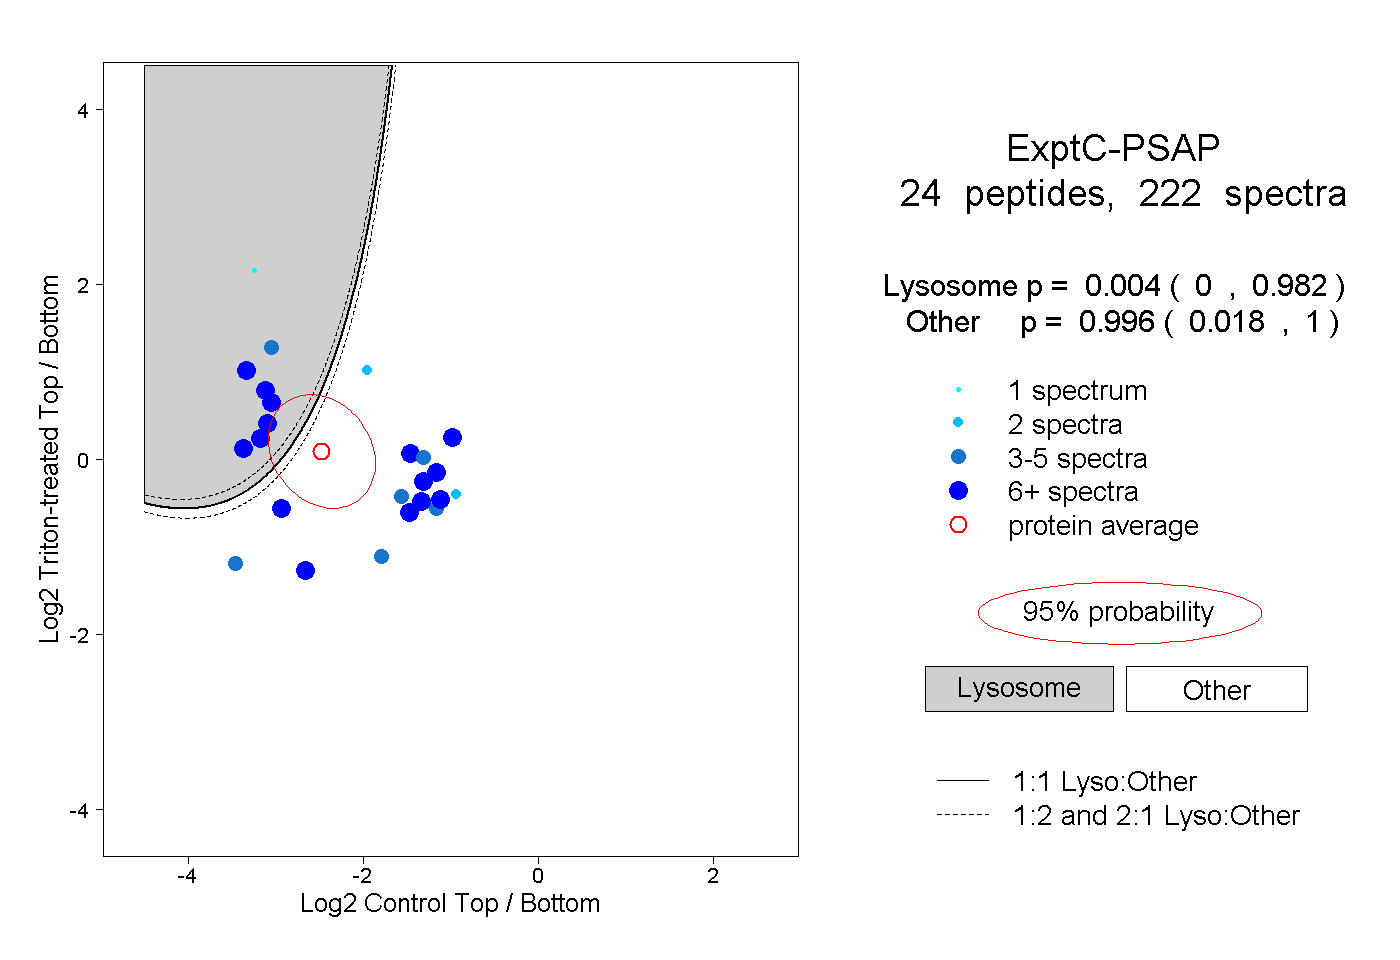
0.000 | 0.982
0.018 | 1.000
12peptides
spectra
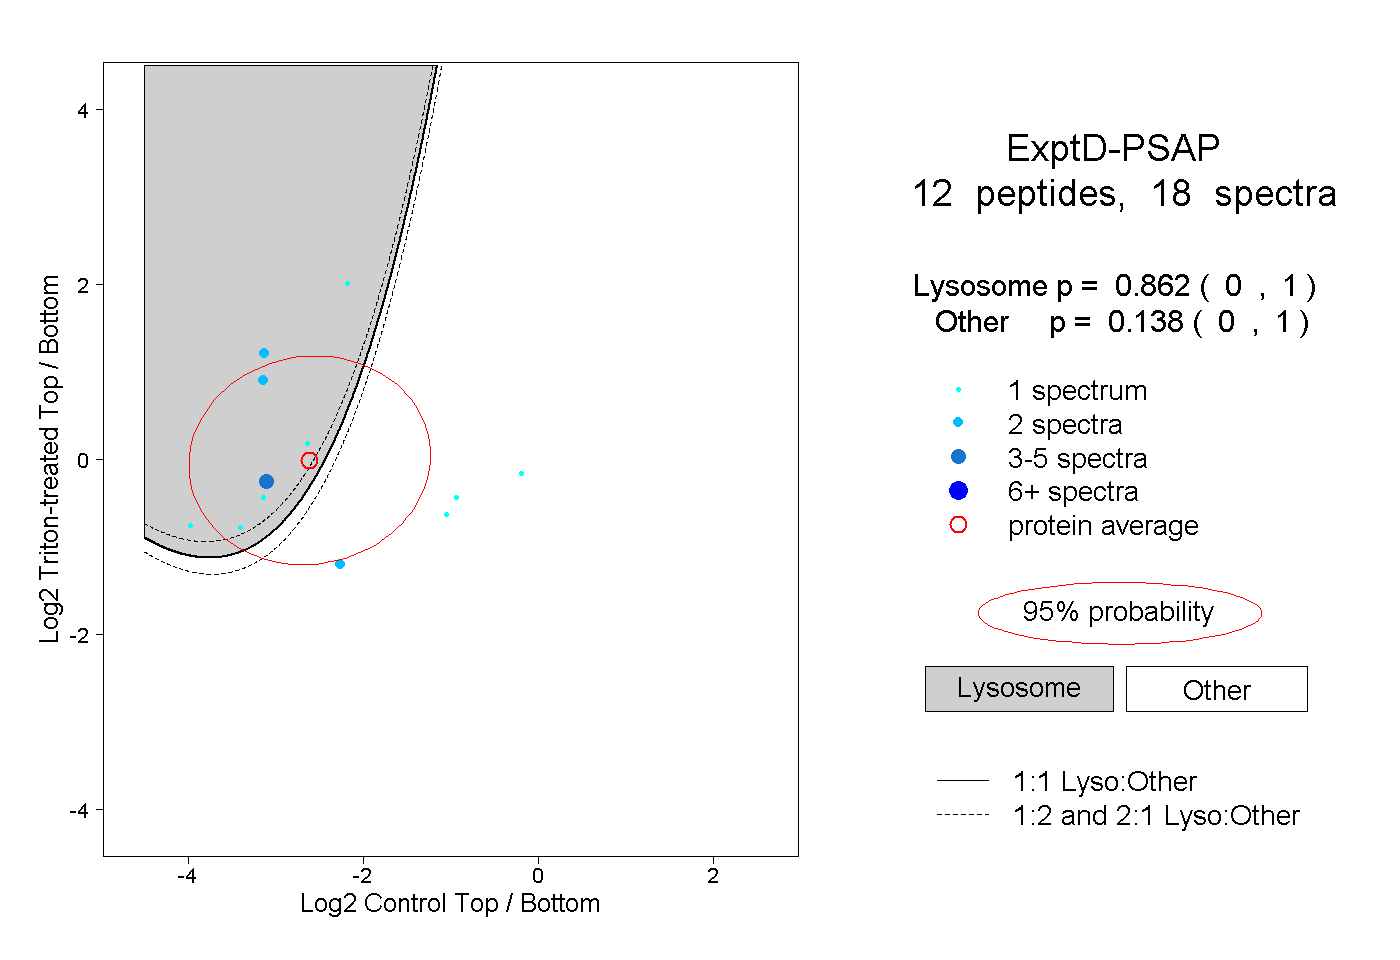
0.000 | 1.000
0.000 | 1.000