4
4peptides
spectra
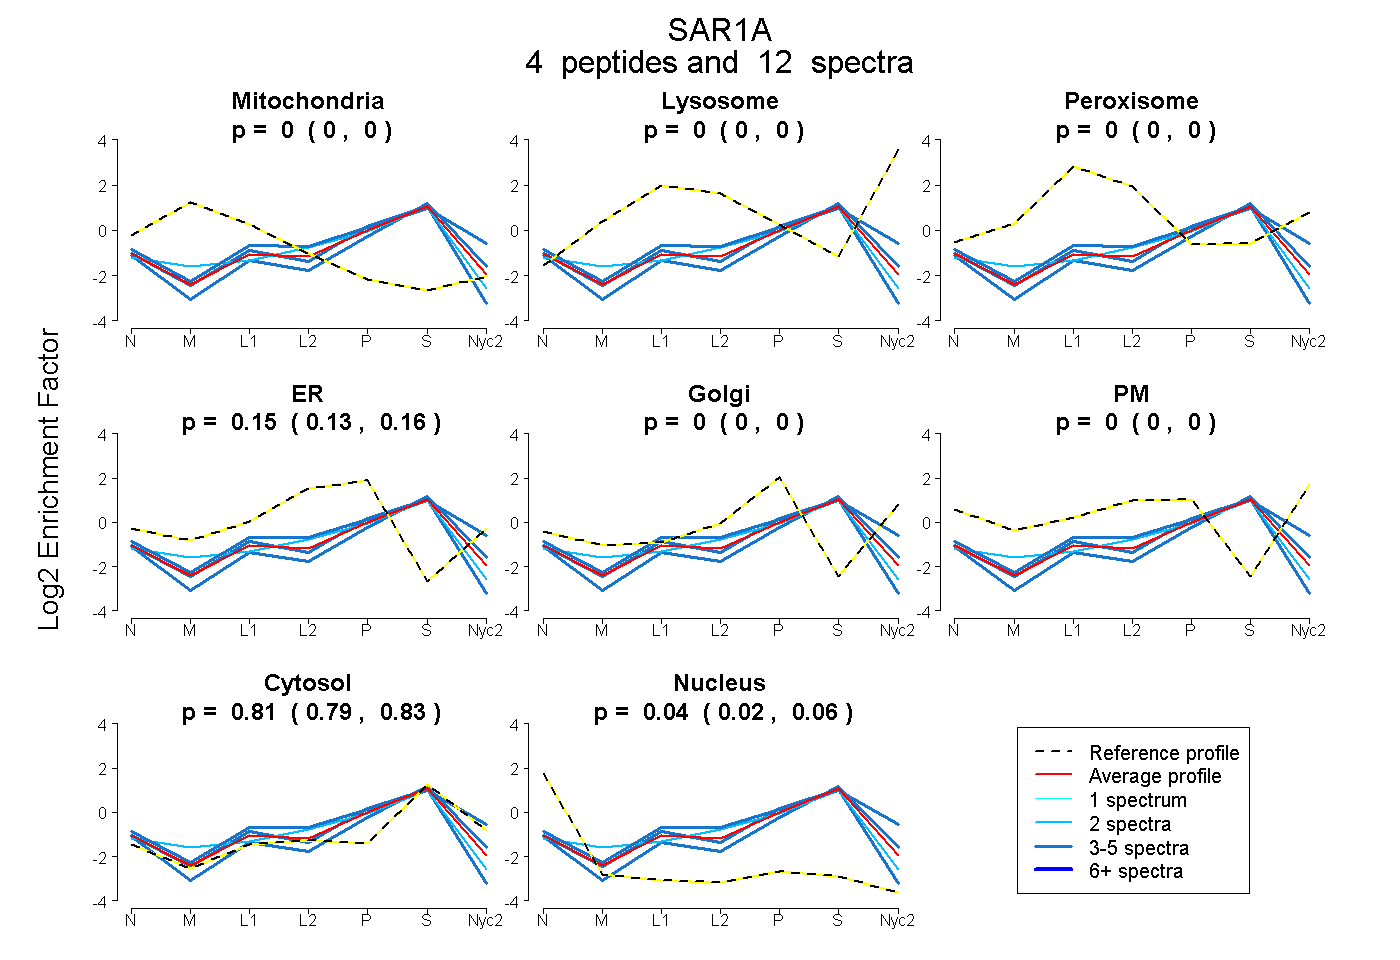
0.000 | 0.000
0.000 | 0.000
0.000 | 0.000
0.132 | 0.163
0.000 | 0.000
0.000 | 0.000
0.794 | 0.827
0.015 | 0.059
5peptides
spectra
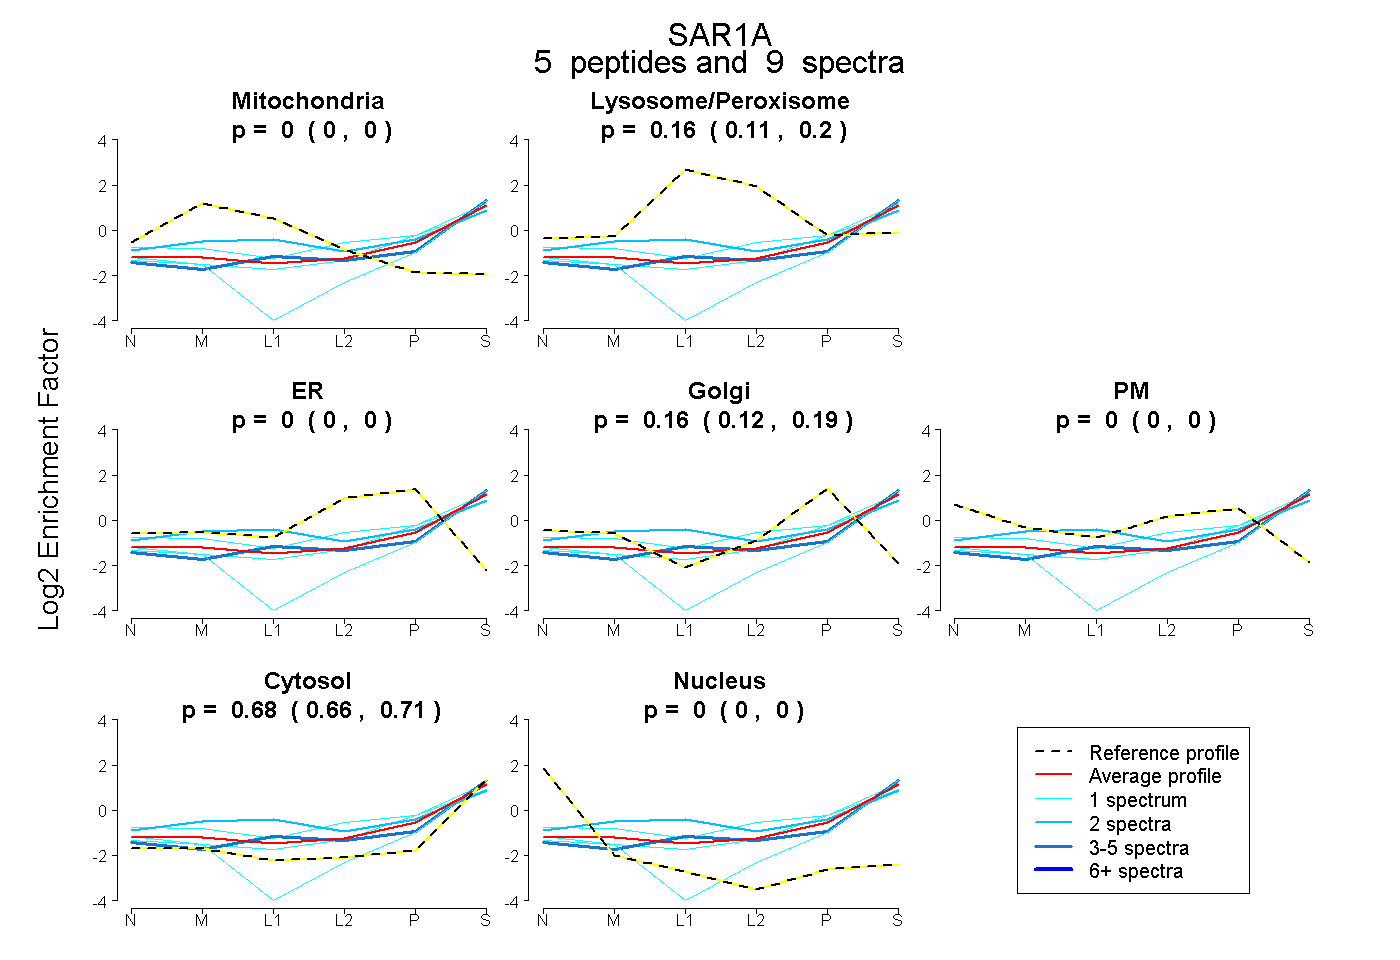
0.000 | 0.000
0.109 | 0.200
0.000 | 0.000
0.118 | 0.190
0.000 | 0.000
0.656 | 0.705
0.000 | 0.000