 4
4peptides
spectra
0.000 | 0.000
0.000 | 0.000
0.000 | 0.000
0.132 | 0.163
0.000 | 0.000
0.000 | 0.000
0.794 | 0.827
0.015 | 0.059
| Plot | Mito | Lyso | Perox | ER | Golgi | PM | Cytosol | Nucleus | |||||
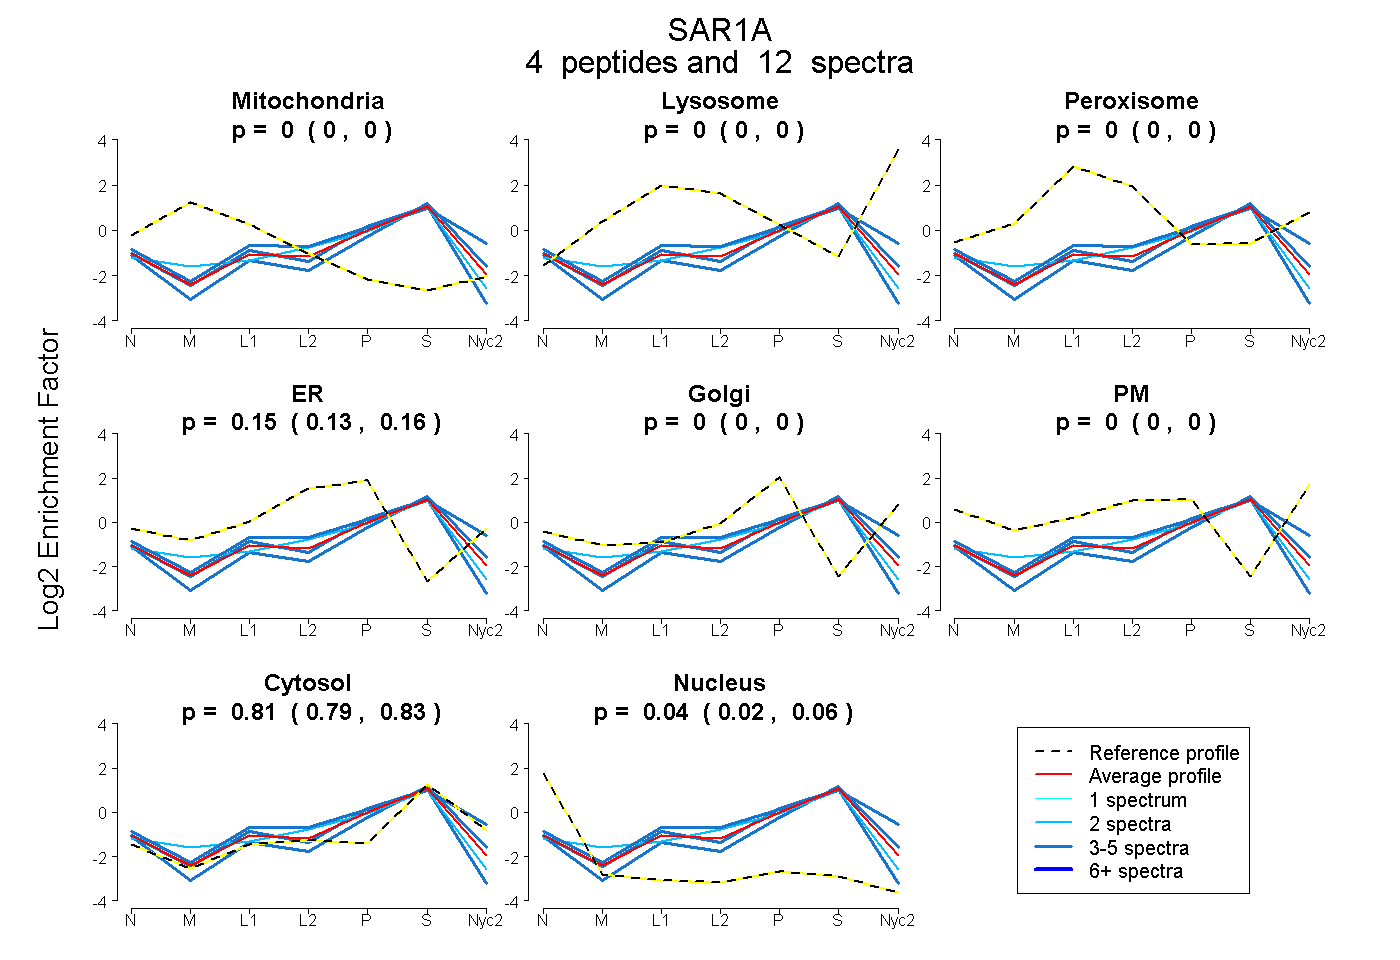
| Expt A |
4 peptides |
12 spectra |
|
0.000 0.000 | 0.000 |
0.000 0.000 | 0.000 |
0.000 0.000 | 0.000 |
0.149 0.132 | 0.163 |
0.000 0.000 | 0.000 |
0.000 0.000 | 0.000 |
0.812 0.794 | 0.827 |
0.039 0.015 | 0.059 |
| 2 spectra, NYLPAINGIVFLVDCADHSR | 0.044 | 0.000 | 0.000 | 0.164 | 0.000 | 0.000 | 0.752 | 0.040 | ||
| 4 spectra, EIFGLYGQTTGK | 0.000 | 0.000 | 0.000 | 0.000 | 0.048 | 0.000 | 0.891 | 0.062 | ||
| 3 spectra, TDAISEEK | 0.000 | 0.000 | 0.055 | 0.119 | 0.100 | 0.000 | 0.726 | 0.000 | ||
| 3 spectra, ELNARPMEVFMCSVLK | 0.000 | 0.000 | 0.000 | 0.127 | 0.000 | 0.000 | 0.749 | 0.124 |
| Plot | Mito | Lyso or Perox | ER | Golgi | PM | Cytosol | Nucleus | ||||||
| Expt B |
5 peptides |
9 spectra |
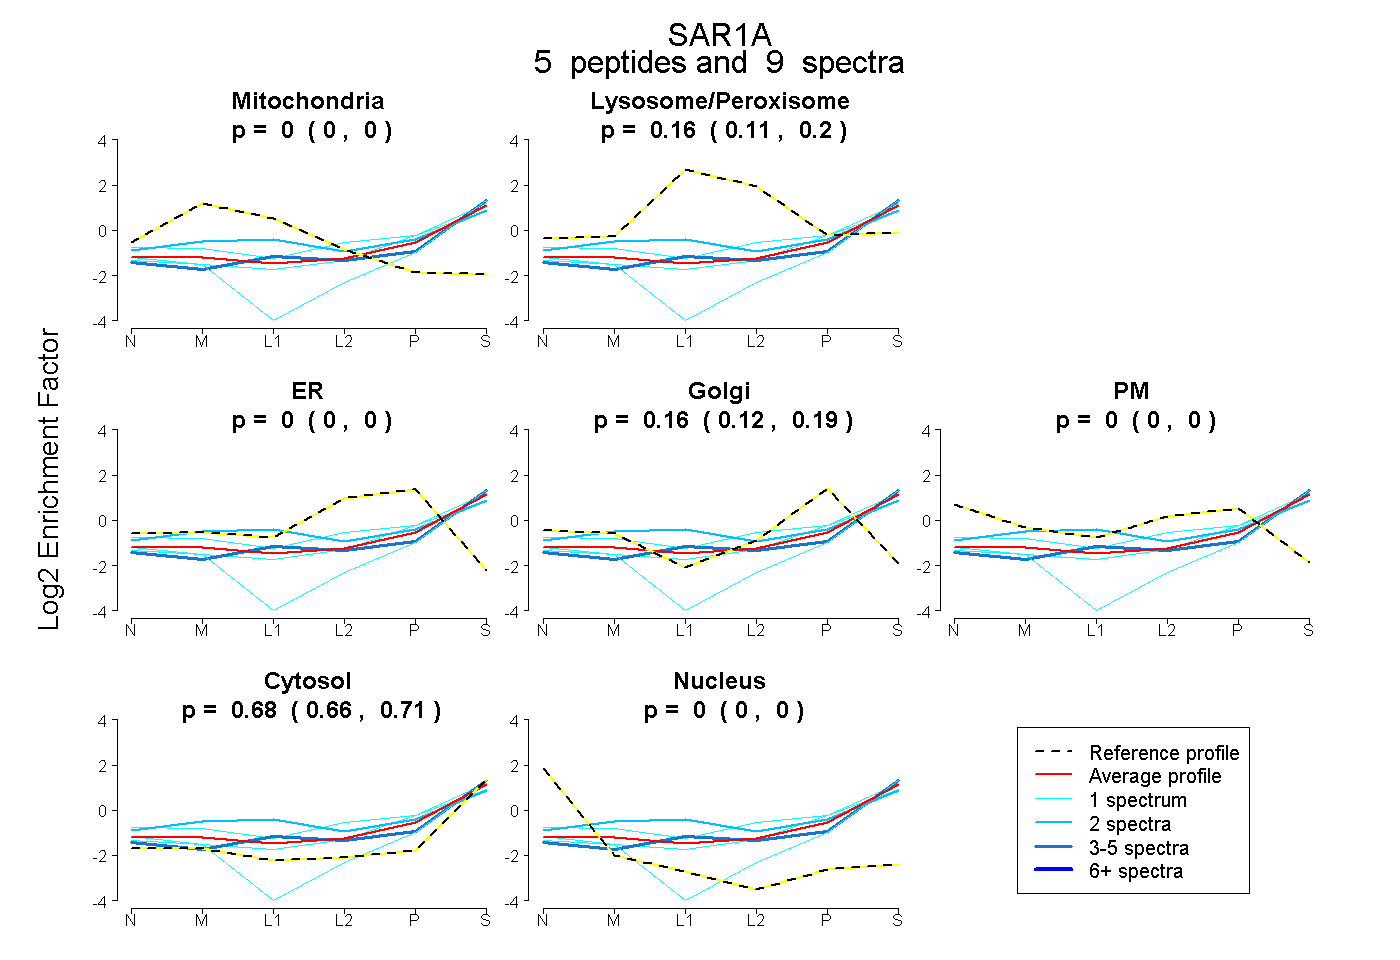 |
0.000 0.000 | 0.000 |
0.156 0.109 | 0.200 |
0.000 0.000 | 0.000 |
0.161 0.118 | 0.190 |
0.000 0.000 | 0.000 |
0.683 0.656 | 0.705 |
0.000 0.000 | 0.000 |
|||
| Plot | Lyso | Other | |||||||||||
| Expt C |
5 peptides |
30 spectra |
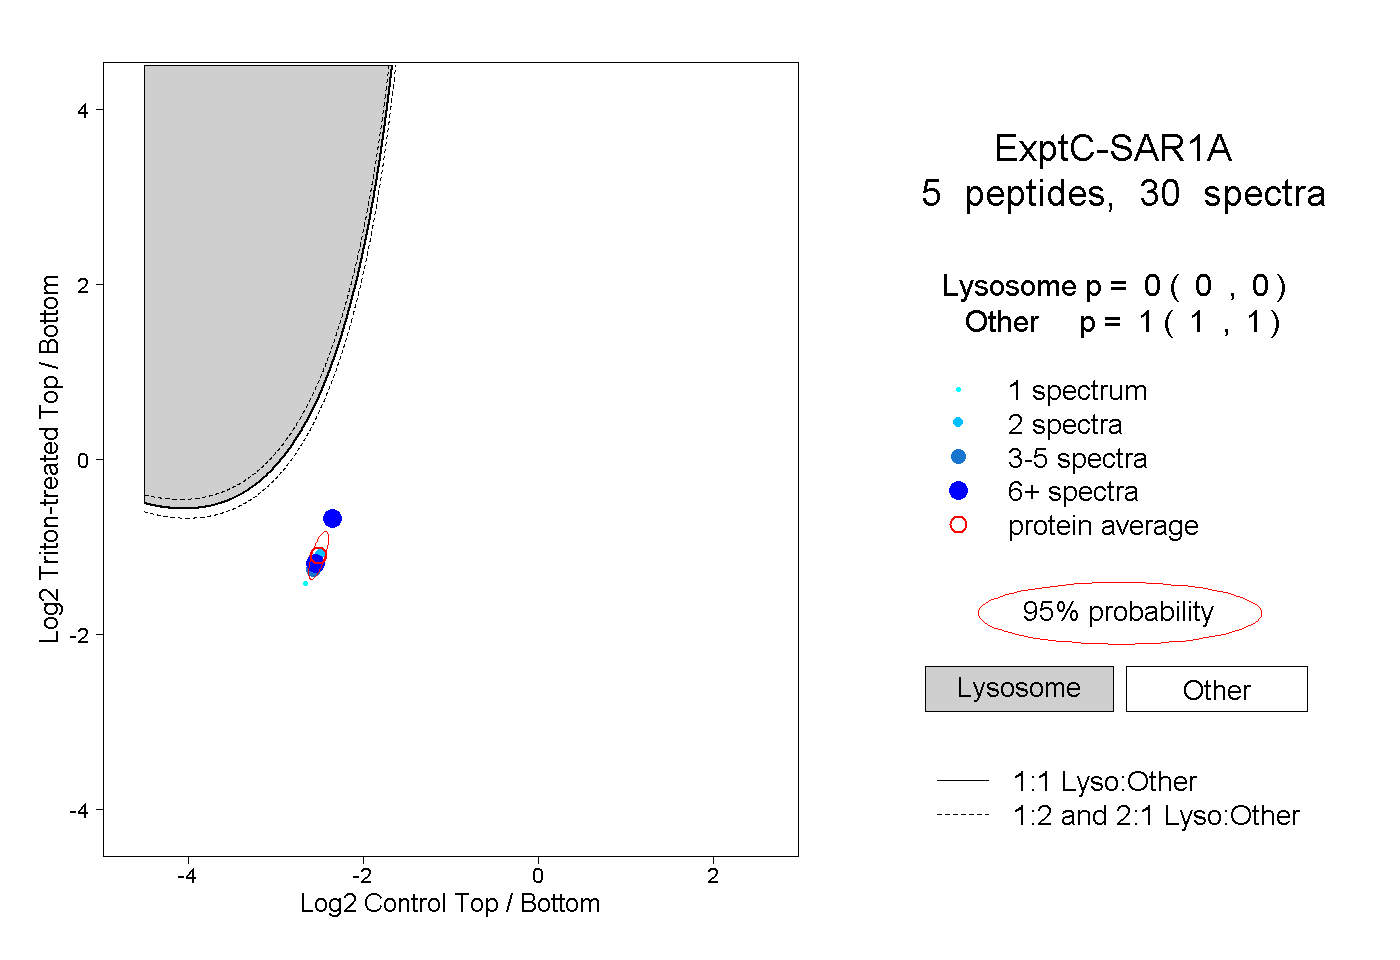 |
0.000 0.000 | 0.000 |
1.000 1.000 | 1.000 |
||||||||
| Plot | Lyso | Other | |||||||||||
| Expt D |
1 peptide |
2 spectra |
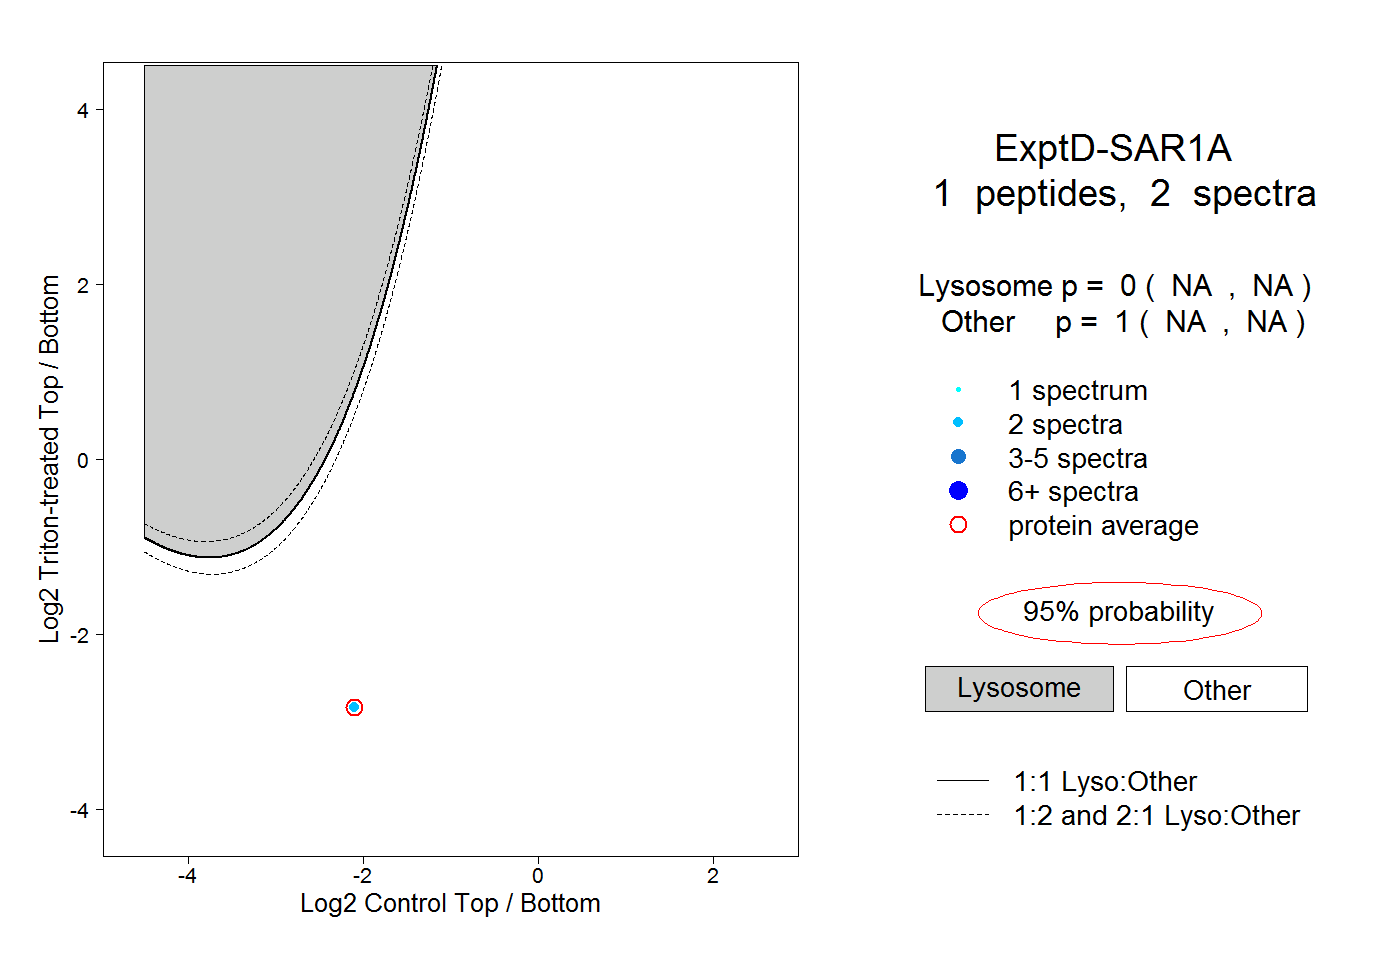 |
0.000 NA | NA |
1.000 NA | NA |