 2
2peptides
spectra
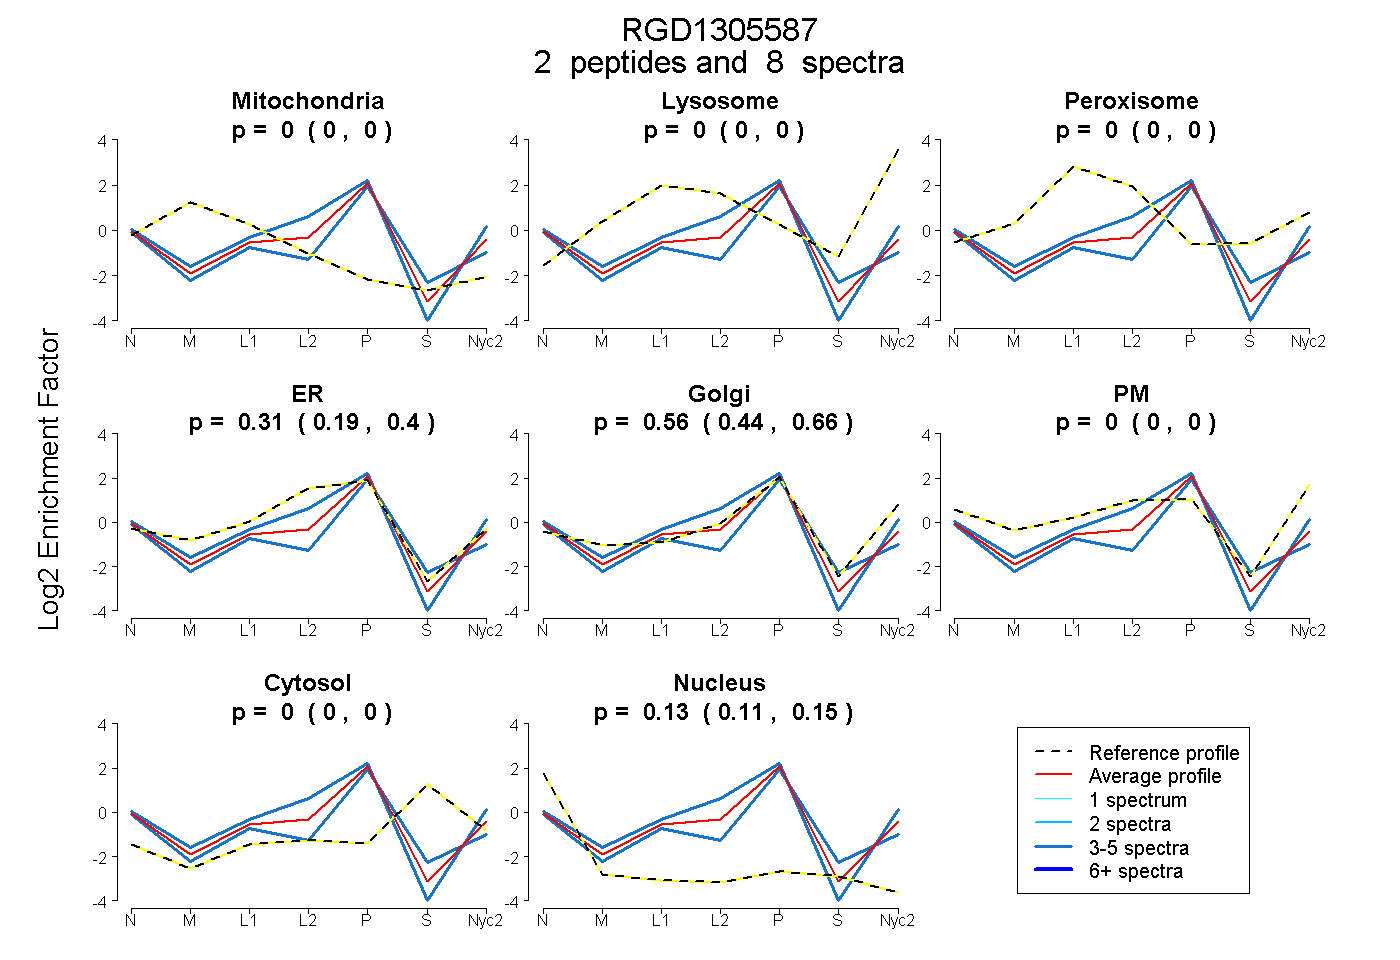
0.000 | 0.000
0.000 | 0.000
0.000 | 0.000
0.194 | 0.404
0.442 | 0.662
0.000 | 0.000
0.000 | 0.000
0.110 | 0.151
3peptides
spectra
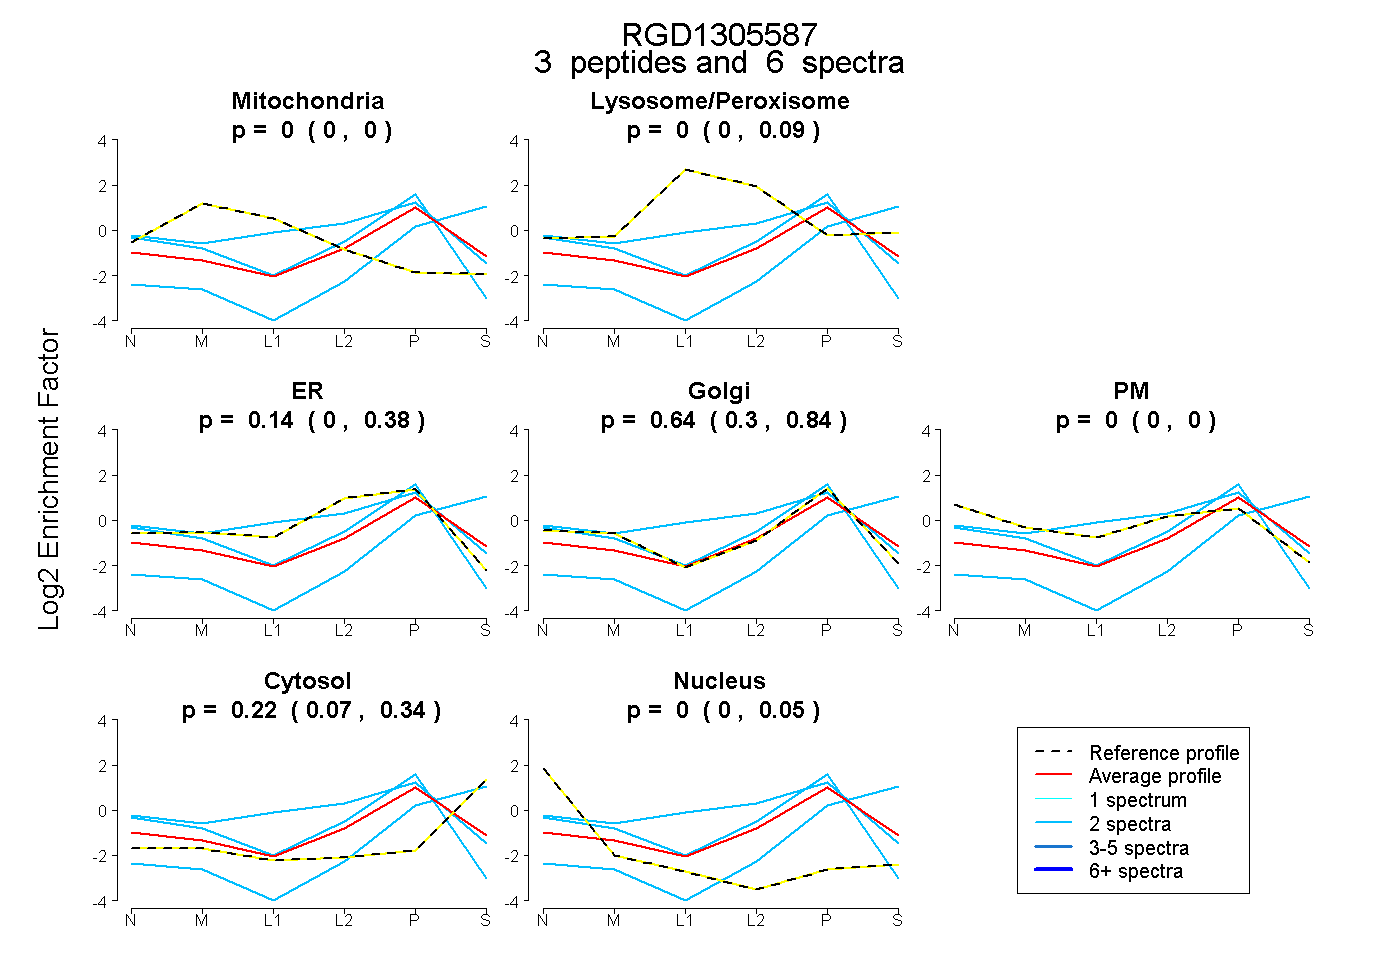
0.000 | 0.000
0.000 | 0.095
0.000 | 0.385
0.297 | 0.843
0.000 | 0.000
0.072 | 0.336
0.000 | 0.047
1peptide
spectrum
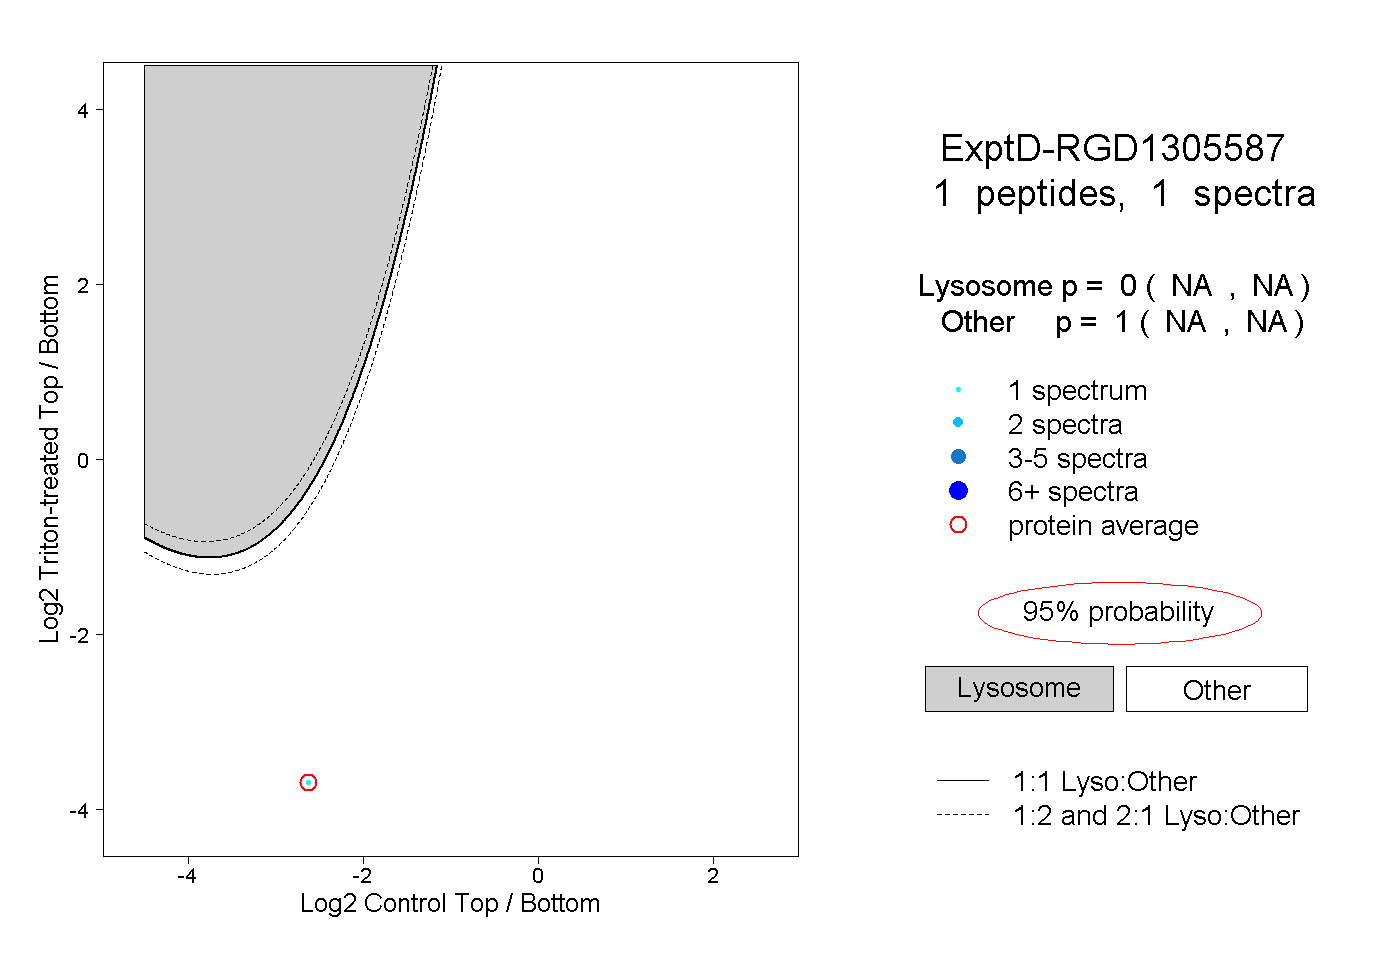
NA | NA
NA | NA