 9
9peptides
spectra
0.000 | 0.000
0.119 | 0.184
0.000 | 0.038
0.000 | 0.000
0.000 | 0.000
0.650 | 0.703
0.137 | 0.164
0.000 | 0.000
12peptides
spectra
0.000 | 0.038
0.962 | 1.000
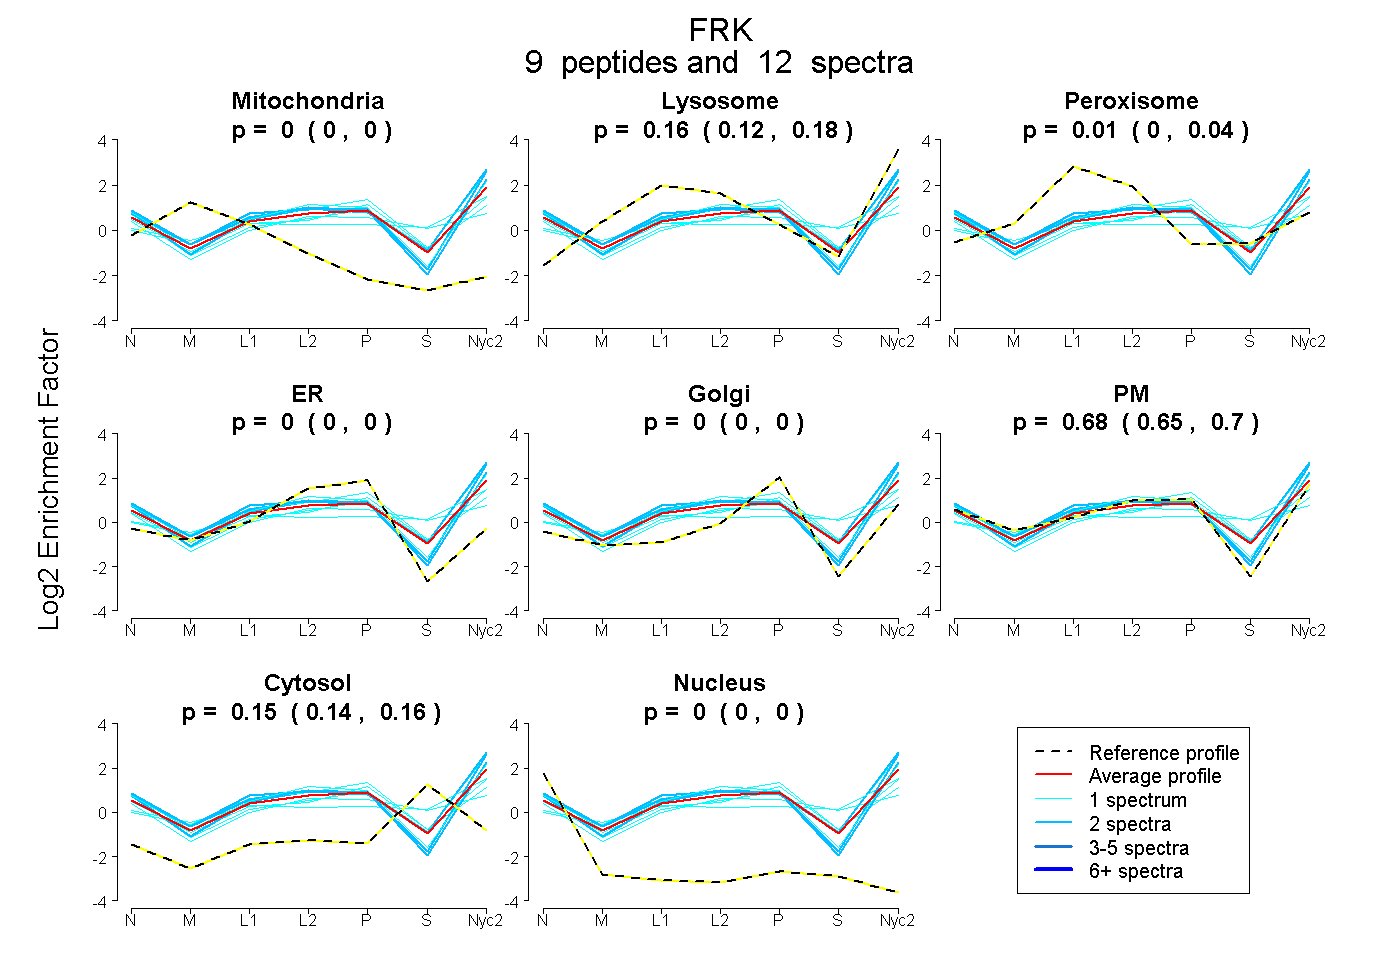
| Plot | Mito | Lyso | Perox | ER | Golgi | PM | Cytosol | Nucleus | |||||
| Expt A |
9 peptides |
12 spectra |
|
0.000 0.000 | 0.000 |
0.157 0.119 | 0.184 |
0.012 0.000 | 0.038 |
0.000 0.000 | 0.000 |
0.000 0.000 | 0.000 |
0.680 0.650 | 0.703 |
0.152 0.137 | 0.164 |
0.000 0.000 | 0.000 |
||
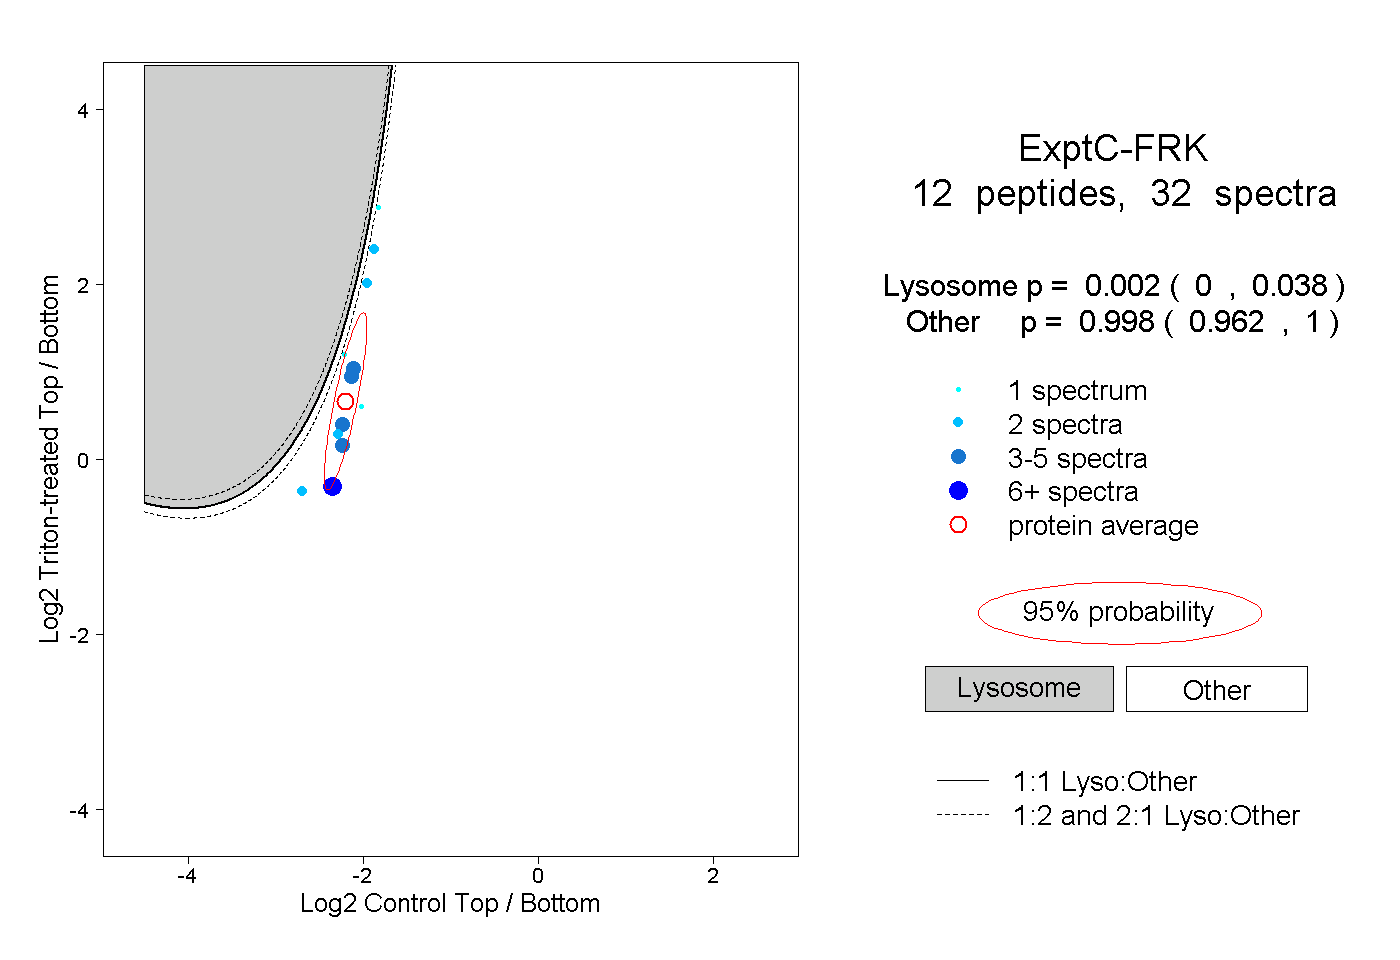
| Plot | Lyso | Other | |||||||||||
| Expt C |
12 peptides |
32 spectra |
|
0.002 0.000 | 0.038 |
0.998 0.962 | 1.000 |