 9
9peptides
spectra
0.000 | 0.000
0.000 | 0.000
0.000 | 0.000
0.000 | 0.000
0.000 | 0.000
0.000 | 0.000
0.985 | 0.994
0.005 | 0.015
| Plot | Mito | Lyso | Perox | ER | Golgi | PM | Cytosol | Nucleus | |||||
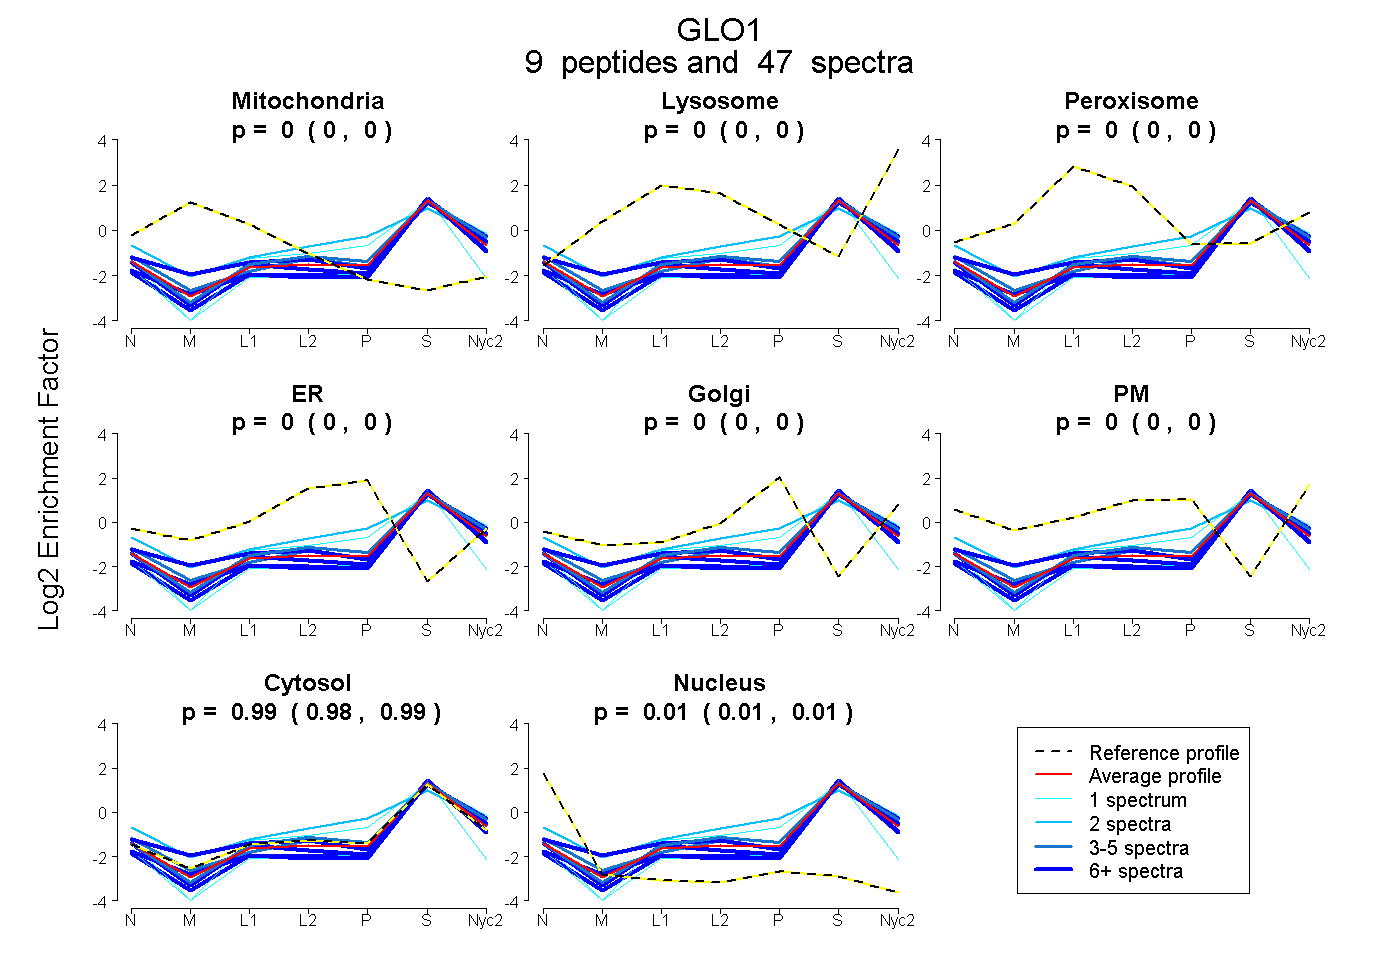
| Expt A |
9 peptides |
47 spectra |
|
0.000 0.000 | 0.000 |
0.000 0.000 | 0.000 |
0.000 0.000 | 0.000 |
0.000 0.000 | 0.000 |
0.000 0.000 | 0.000 |
0.000 0.000 | 0.000 |
0.990 0.985 | 0.994 |
0.010 0.005 | 0.015 |
| 8 spectra, LDFPSMK | 0.000 | 0.000 | 0.000 | 0.000 | 0.000 | 0.000 | 0.953 | 0.047 | ||
| 2 spectra, KPDDGK | 0.000 | 0.000 | 0.000 | 0.021 | 0.077 | 0.131 | 0.771 | 0.000 | ||
| 3 spectra, VLGLTLLQK | 0.000 | 0.009 | 0.000 | 0.000 | 0.000 | 0.000 | 0.991 | 0.000 | ||
| 8 spectra, SLDFYTR | 0.000 | 0.000 | 0.000 | 0.000 | 0.000 | 0.000 | 0.990 | 0.010 | ||
| 14 spectra, TAWAFSR | 0.027 | 0.057 | 0.000 | 0.000 | 0.000 | 0.000 | 0.916 | 0.000 | ||
| 1 spectrum, FSLYFLAYEDK | 0.000 | 0.000 | 0.000 | 0.000 | 0.052 | 0.000 | 0.948 | 0.000 | ||
| 6 spectra, DFLLQQTMLR | 0.000 | 0.000 | 0.000 | 0.000 | 0.000 | 0.000 | 0.967 | 0.033 | ||
| 1 spectrum, GFGHIGIAVPDVYEACK | 0.000 | 0.000 | 0.000 | 0.000 | 0.000 | 0.000 | 0.873 | 0.127 | ||
| 4 spectra, FEELGVK | 0.000 | 0.000 | 0.000 | 0.000 | 0.000 | 0.000 | 0.978 | 0.022 |
| Plot | Mito | Lyso or Perox | ER | Golgi | PM | Cytosol | Nucleus | ||||||
| Expt B |
4 peptides |
16 spectra |
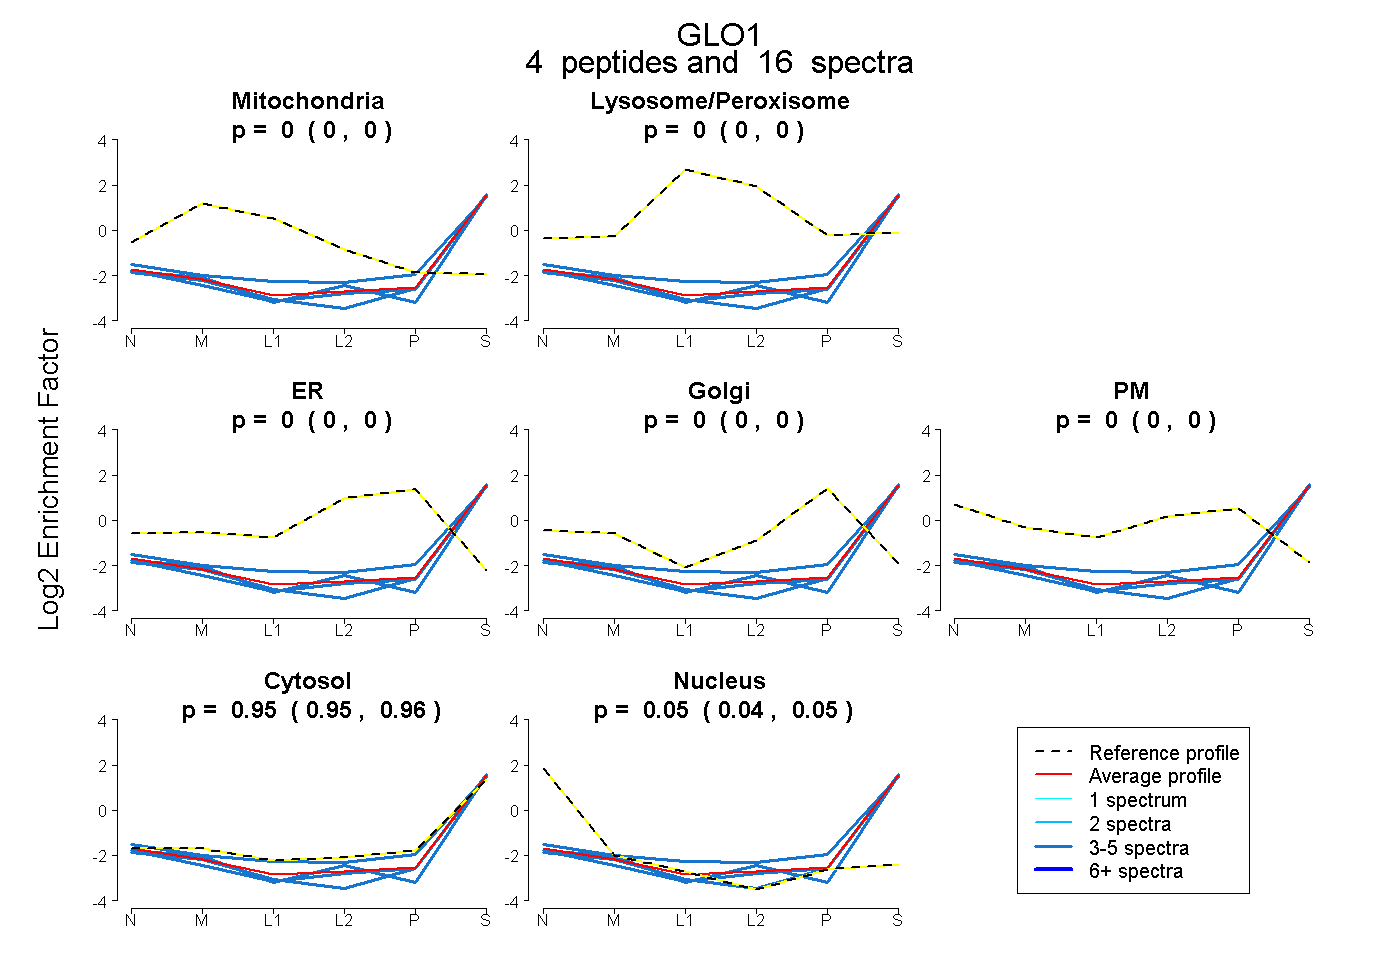 |
0.000 0.000 | 0.000 |
0.000 0.000 | 0.000 |
0.000 0.000 | 0.000 |
0.000 0.000 | 0.000 |
0.000 0.000 | 0.000 |
0.954 0.945 | 0.962 |
0.046 0.036 | 0.054 |
|||
| Plot | Lyso | Other | |||||||||||
| Expt C |
8 peptides |
65 spectra |
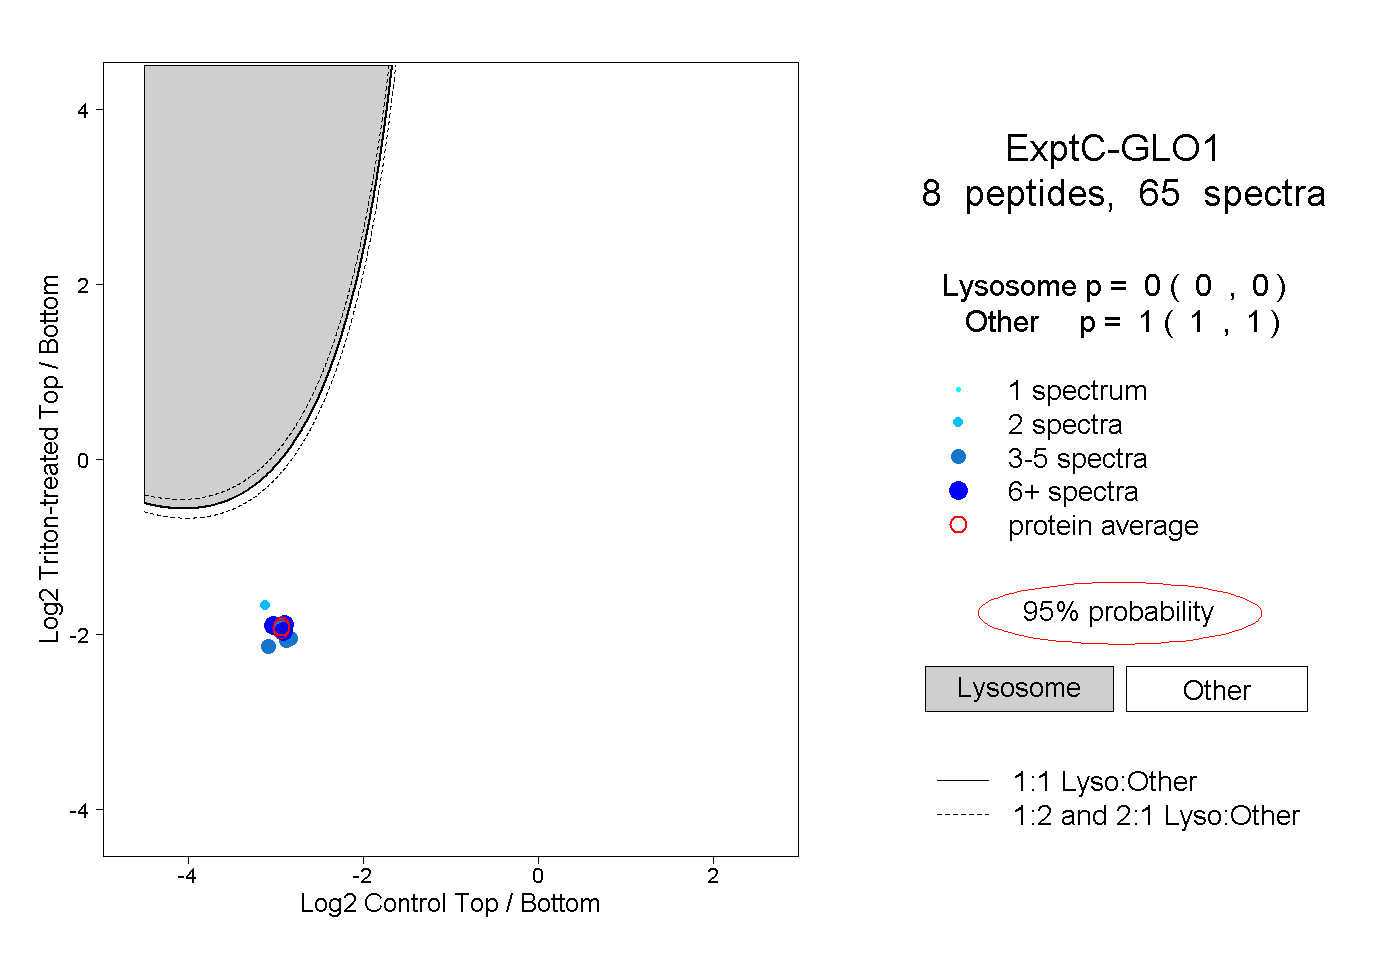 |
0.000 0.000 | 0.000 |
1.000 1.000 | 1.000 |
||||||||
| Plot | Lyso | Other | |||||||||||
| Expt D |
2 peptides |
6 spectra |
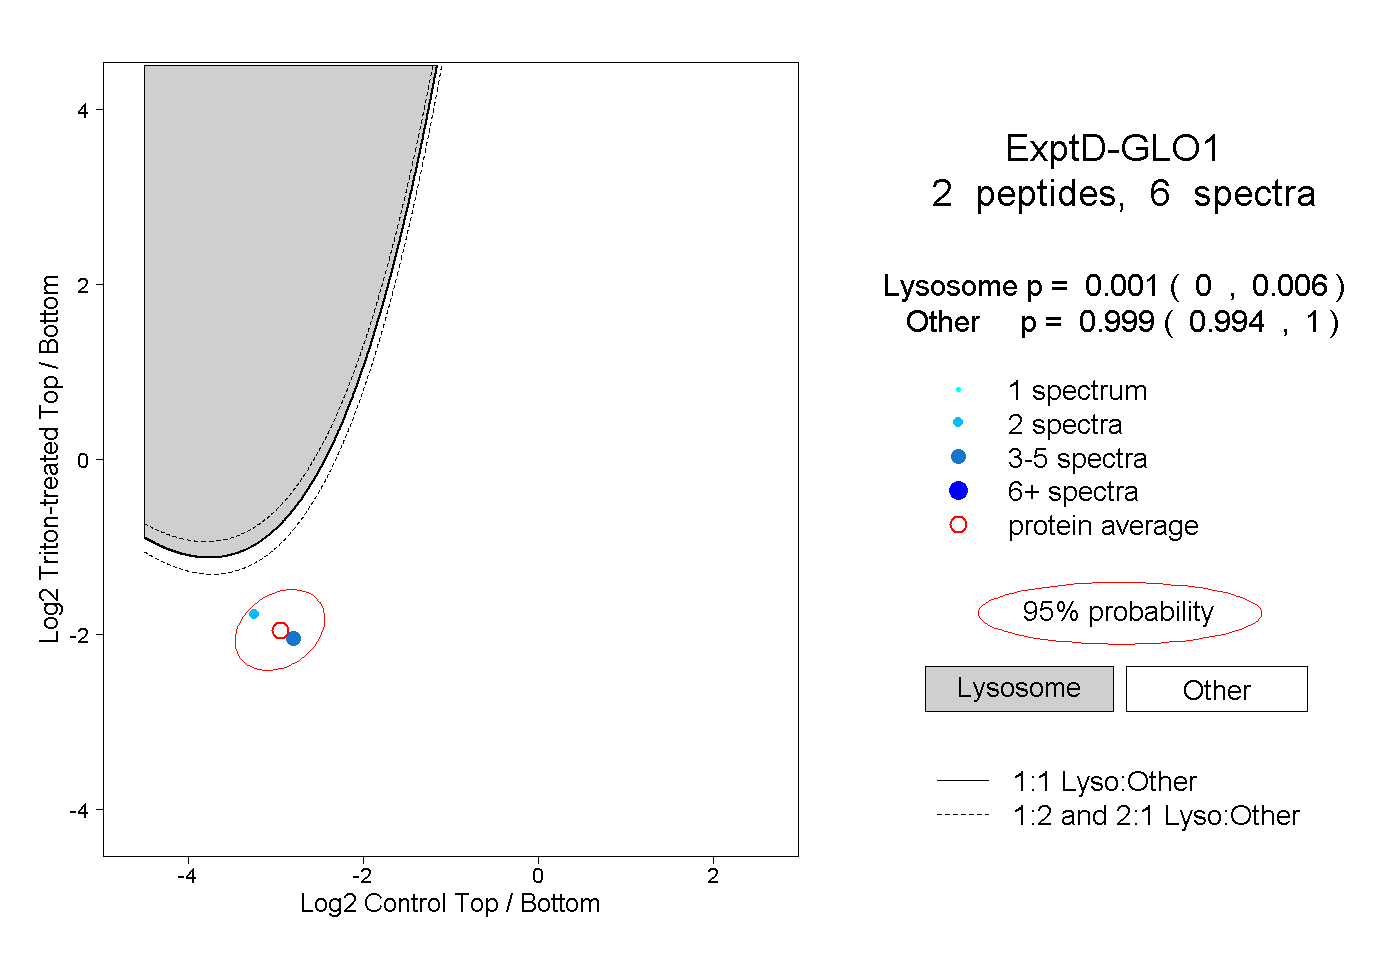 |
0.001 0.000 | 0.006 |
0.999 0.994 | 1.000 |