 5
5peptides
spectra
0.000 | 0.000
0.000 | 0.000
0.000 | 0.000
0.484 | 0.495
0.000 | 0.000
0.000 | 0.000
0.080 | 0.100
0.412 | 0.425
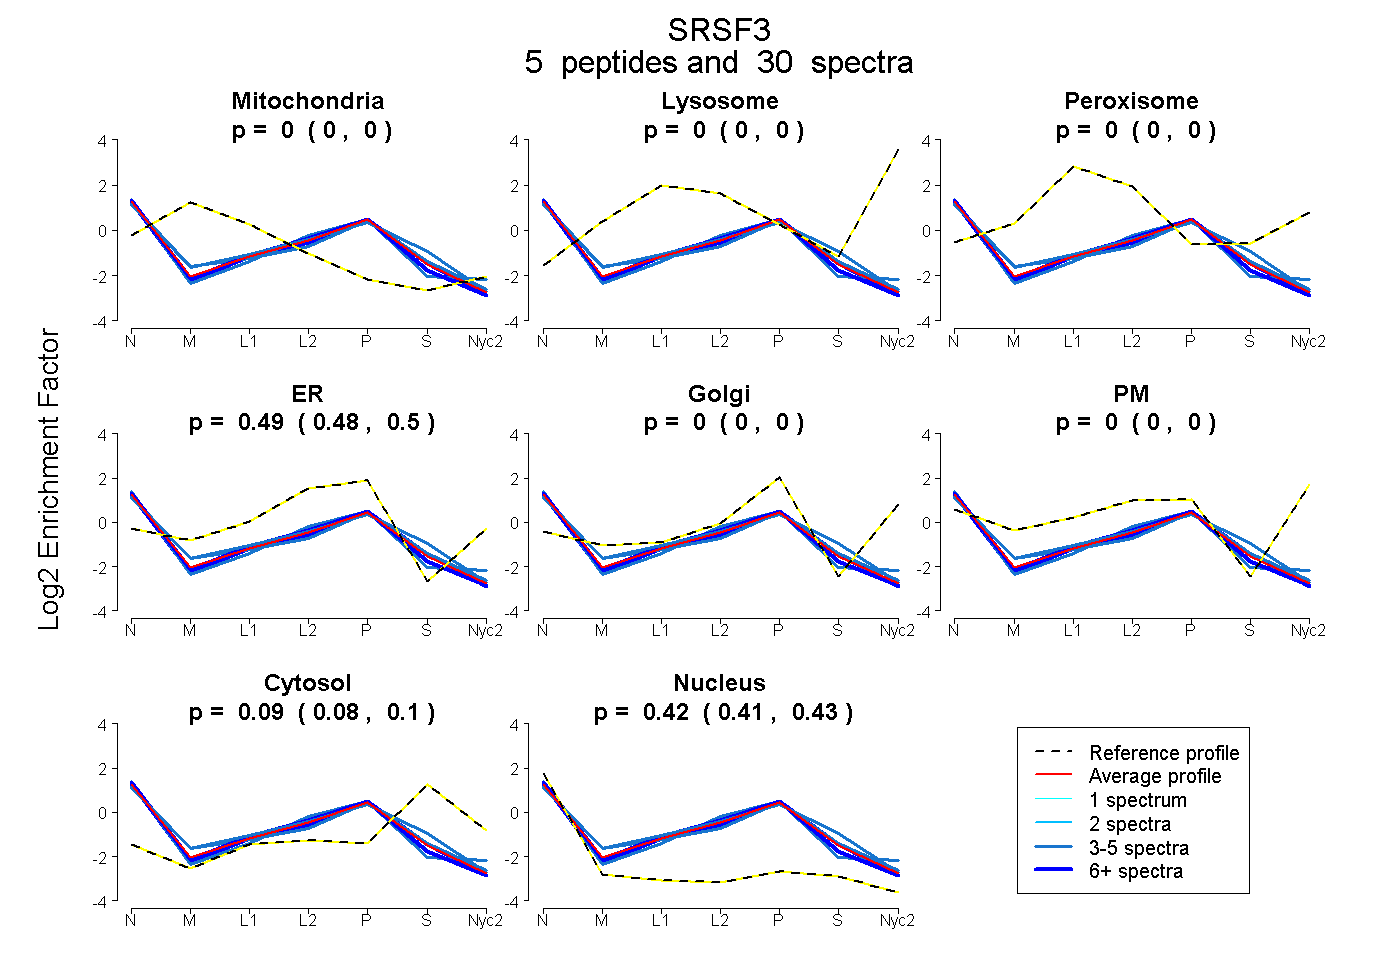
| Plot | Mito | Lyso | Perox | ER | Golgi | PM | Cytosol | Nucleus | |||||
| Expt A |
5 peptides |
30 spectra |
|
0.000 0.000 | 0.000 |
0.000 0.000 | 0.000 |
0.000 0.000 | 0.000 |
0.490 0.484 | 0.495 |
0.000 0.000 | 0.000 |
0.000 0.000 | 0.000 |
0.090 0.080 | 0.100 |
0.419 0.412 | 0.425 |
| 9 spectra, SVWVAR | 0.000 | 0.000 | 0.000 | 0.516 | 0.000 | 0.000 | 0.036 | 0.447 | ||
| 5 spectra, GPPPSWGR | 0.000 | 0.000 | 0.000 | 0.476 | 0.000 | 0.000 | 0.117 | 0.407 | ||
| 3 spectra, VELSNGEK | 0.000 | 0.000 | 0.009 | 0.450 | 0.000 | 0.000 | 0.190 | 0.352 | ||
| 3 spectra, NHKPSR | 0.000 | 0.000 | 0.000 | 0.545 | 0.000 | 0.000 | 0.024 | 0.430 | ||
| 10 spectra, AFGYYGPLR | 0.000 | 0.000 | 0.000 | 0.467 | 0.000 | 0.000 | 0.103 | 0.430 |
| Plot | Mito | Lyso or Perox | ER | Golgi | PM | Cytosol | Nucleus | ||||||
| Expt B |
1 peptide |
2 spectra |
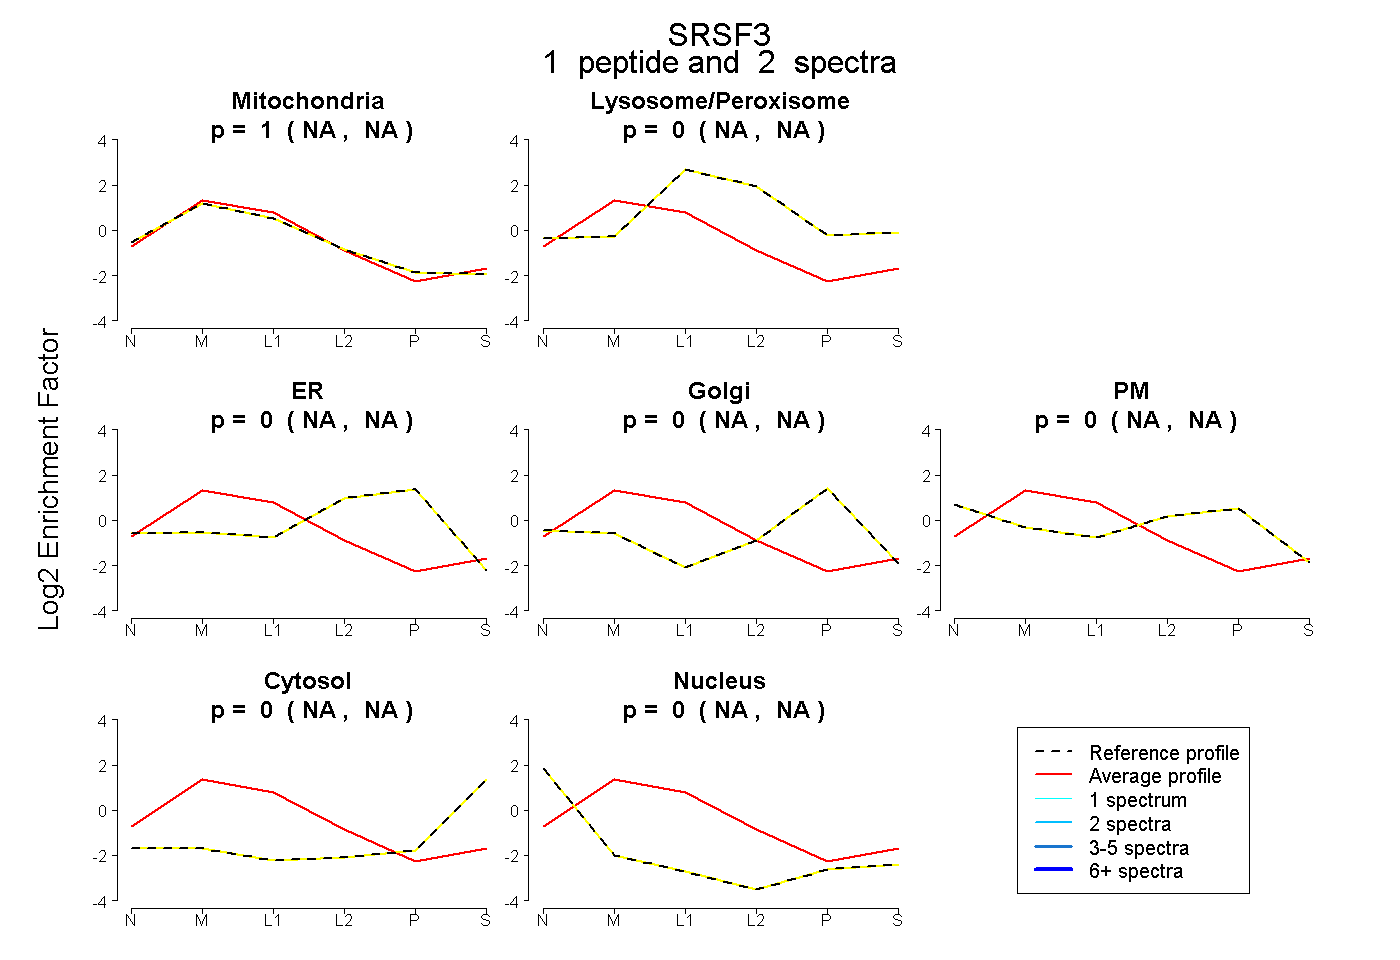 |
0.998 NA | NA |
0.002 NA | NA |
0.000 NA | NA |
0.000 NA | NA |
0.000 NA | NA |
0.000 NA | NA |
0.000 NA | NA |
|||
| Plot | Lyso | Other | |||||||||||
| Expt C |
6 peptides |
27 spectra |
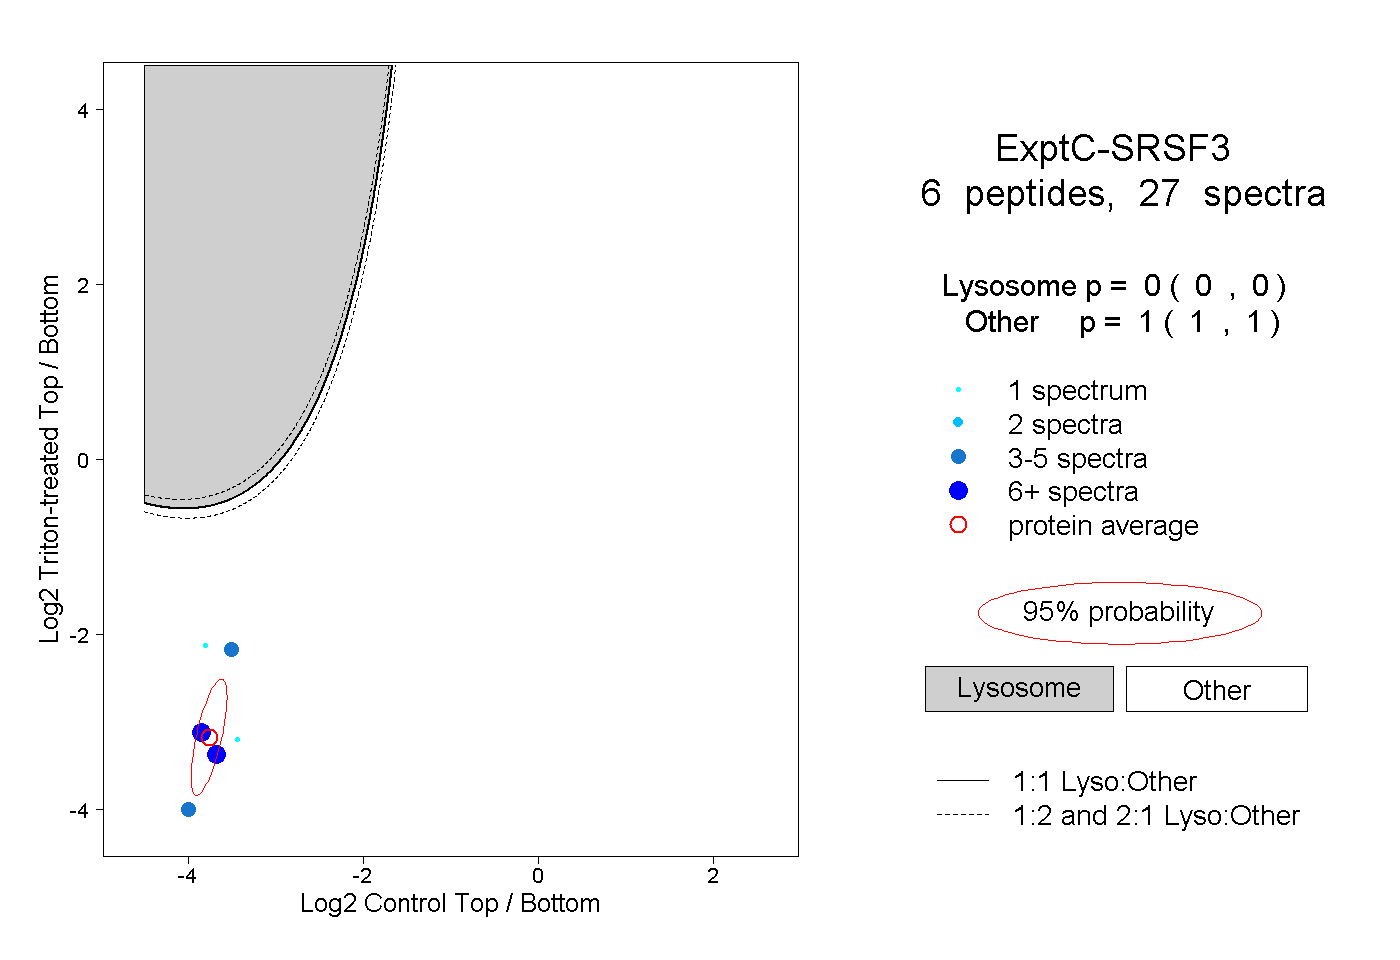 |
0.000 0.000 | 0.000 |
1.000 1.000 | 1.000 |
||||||||
| Plot | Lyso | Other | |||||||||||
| Expt D |
1 peptide |
2 spectra |
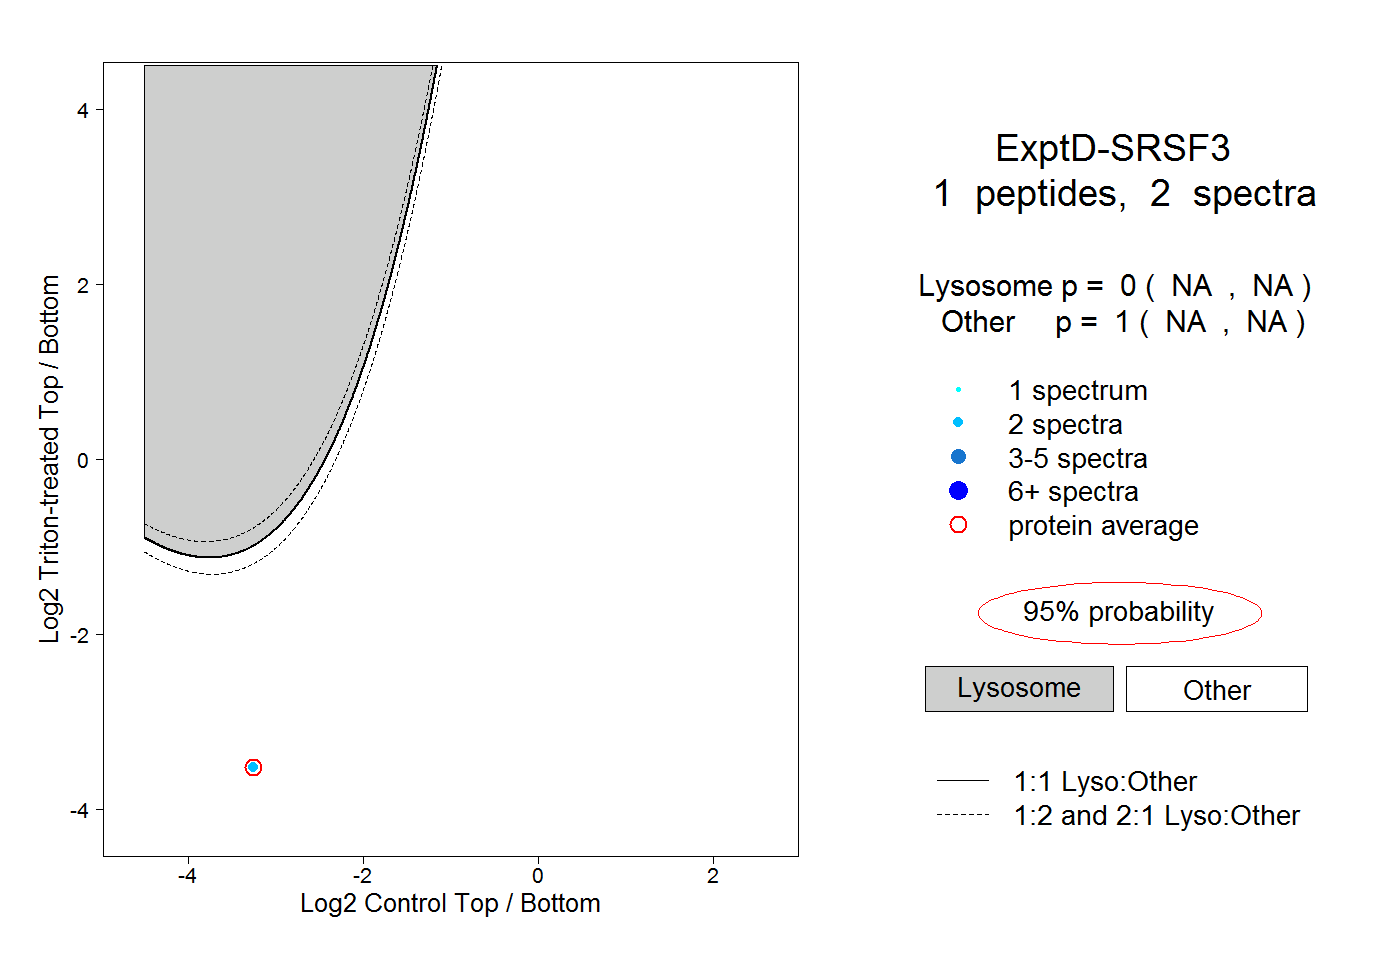 |
0.000 NA | NA |
1.000 NA | NA |