13
13peptides
spectra
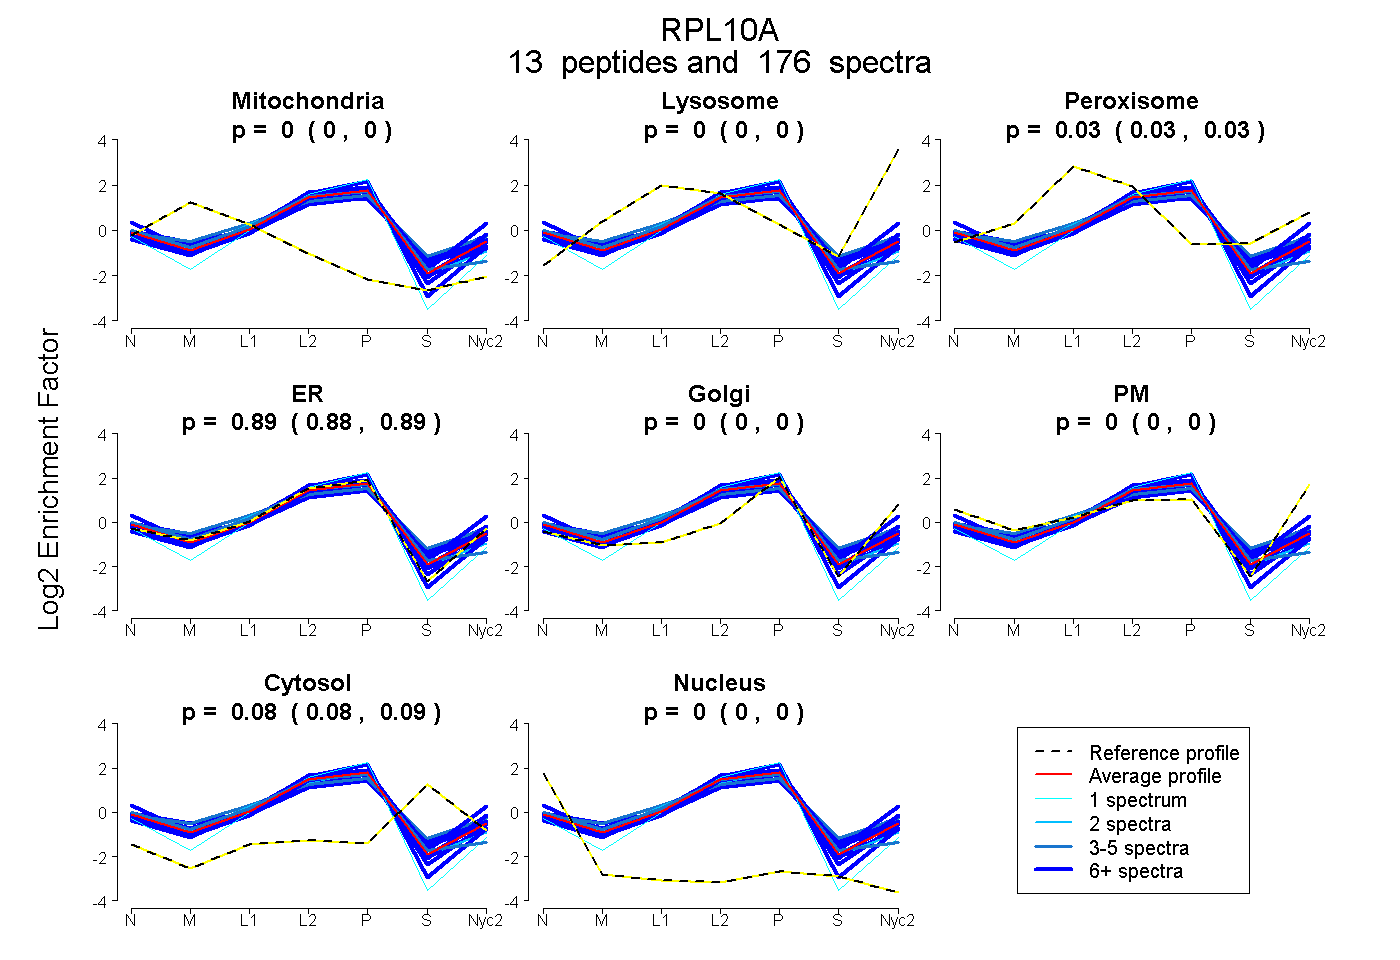
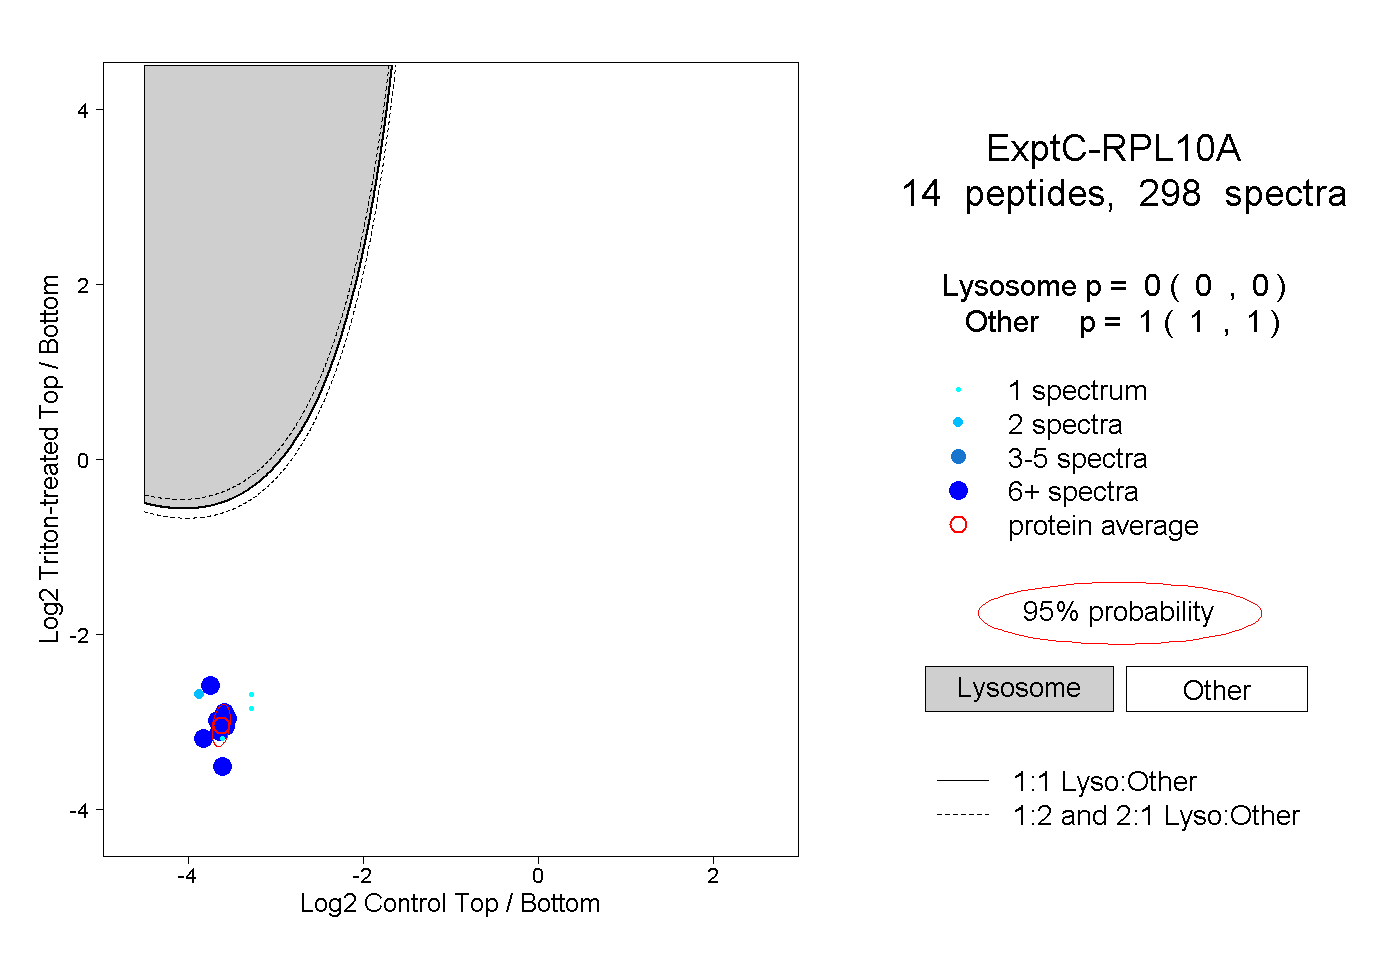
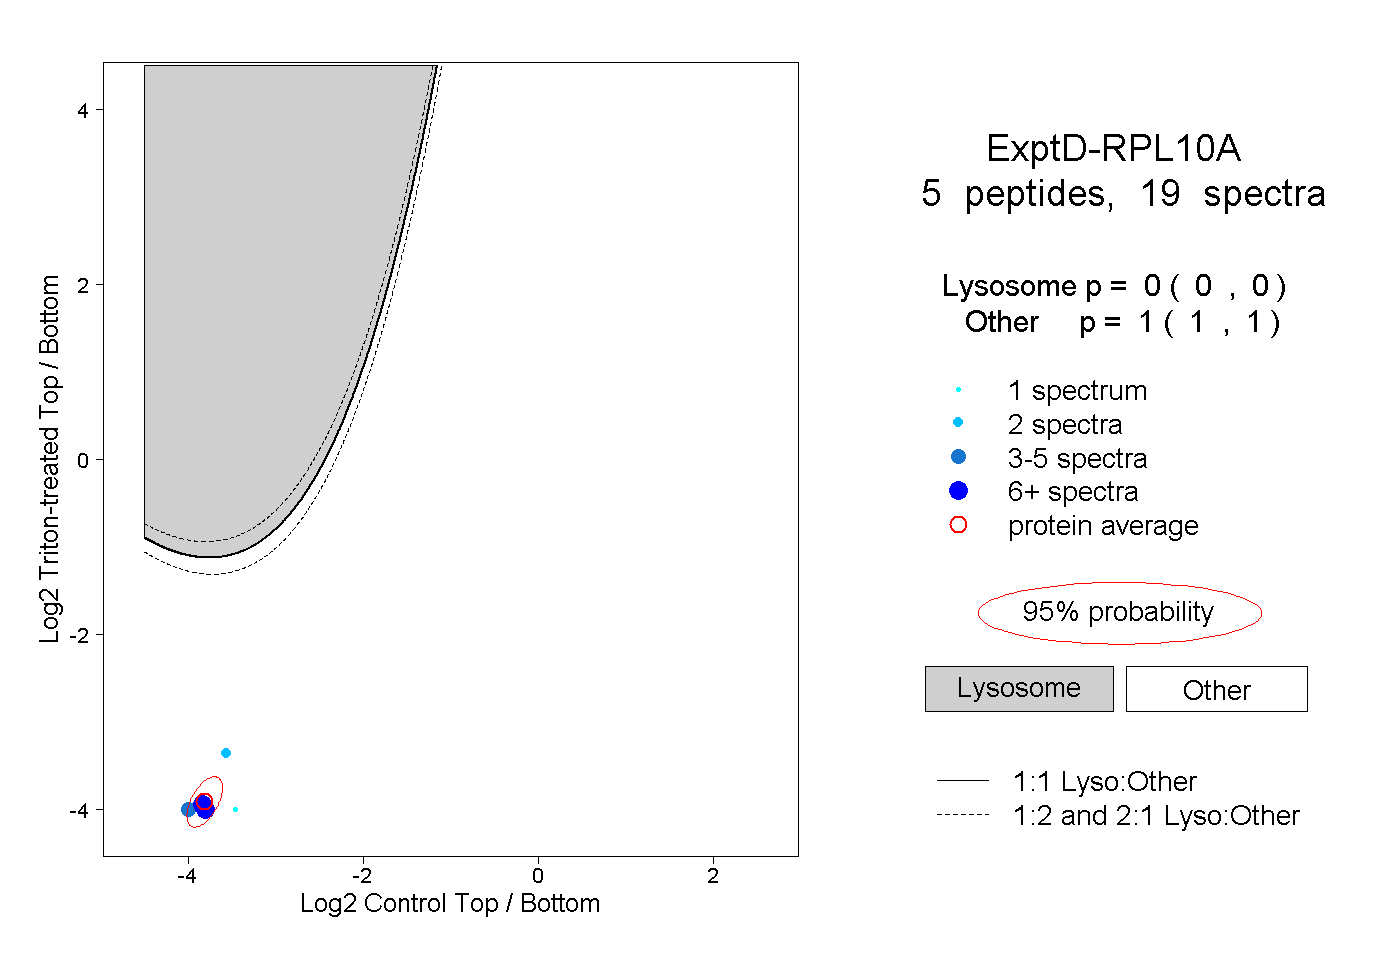
0.000 | 0.000
0.000 | 0.000
0.026 | 0.030
0.884 | 0.891
0.000 | 0.000
0.000 | 0.000
0.082 | 0.086
0.000 | 0.000
10peptides
spectra
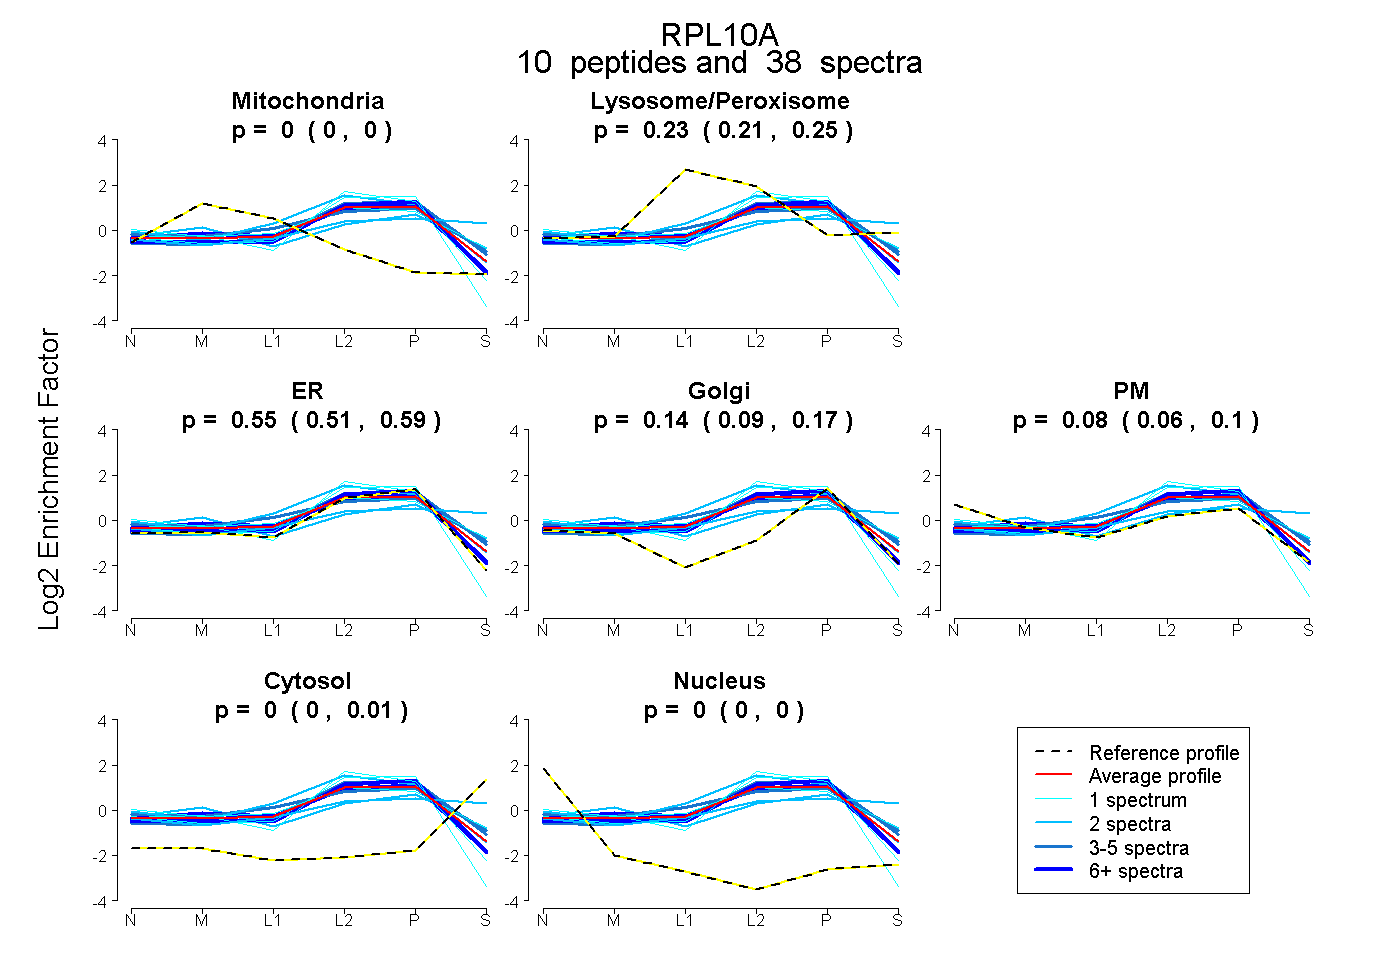
0.000 | 0.000
0.211 | 0.249
0.507 | 0.587
0.089 | 0.170
0.057 | 0.099
0.000 | 0.012
0.000 | 0.000