 13
13peptides
spectra
0.000 | 0.000
0.000 | 0.000
0.026 | 0.030
0.884 | 0.891
0.000 | 0.000
0.000 | 0.000
0.082 | 0.086
0.000 | 0.000
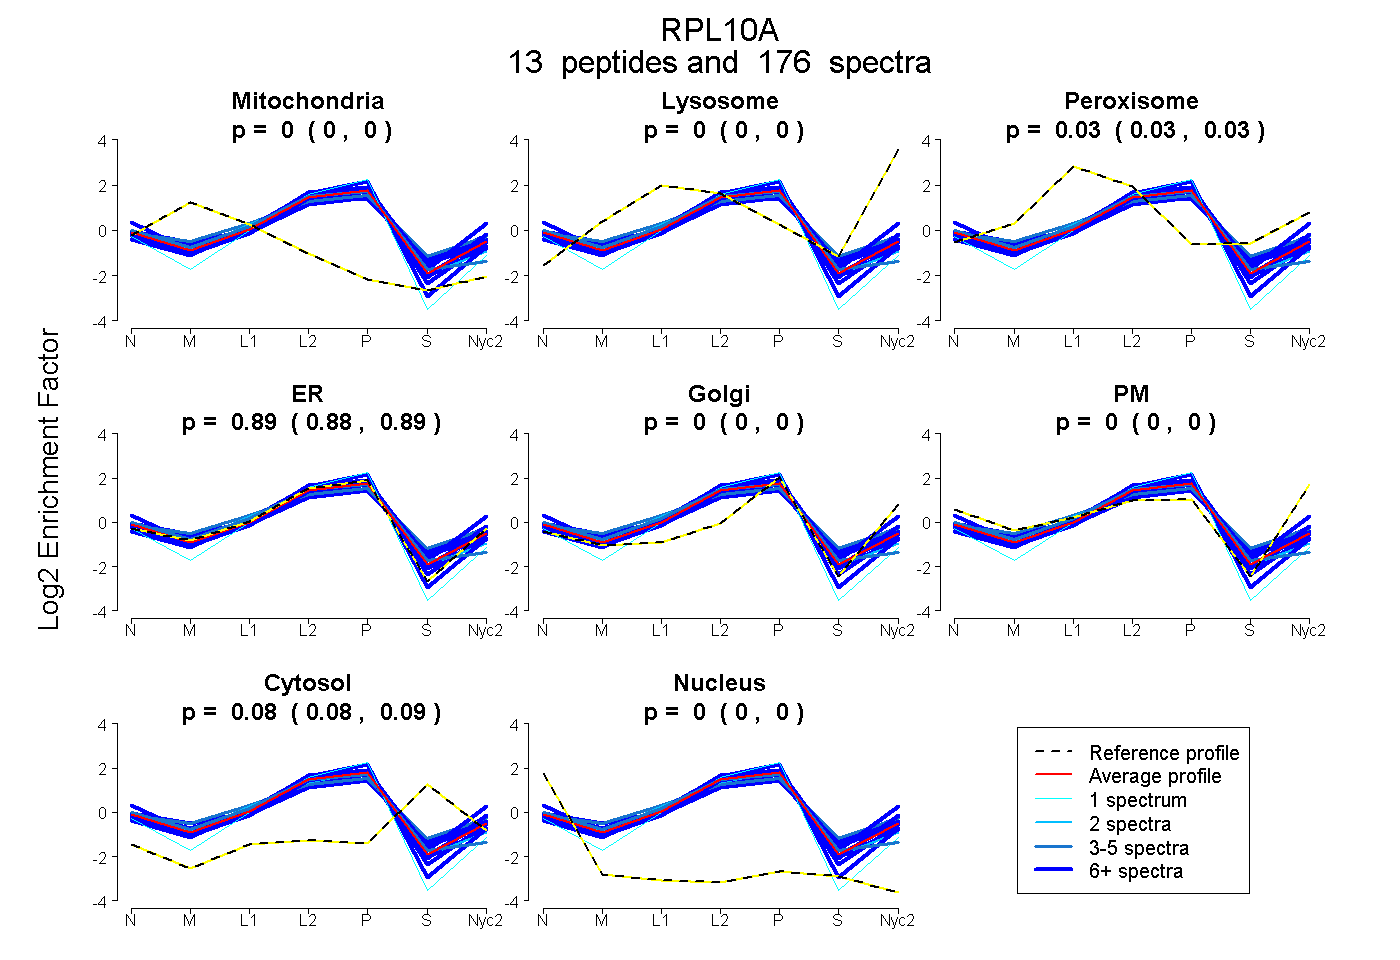
| Plot | Mito | Lyso | Perox | ER | Golgi | PM | Cytosol | Nucleus | |||||
| Expt A |
13 peptides |
176 spectra |
|
0.000 0.000 | 0.000 |
0.000 0.000 | 0.000 |
0.028 0.026 | 0.030 |
0.888 0.884 | 0.891 |
0.000 0.000 | 0.000 |
0.000 0.000 | 0.000 |
0.084 0.082 | 0.086 |
0.000 0.000 | 0.000 |
| 24 spectra, EVLHGNQR | 0.000 | 0.000 | 0.040 | 0.650 | 0.000 | 0.150 | 0.157 | 0.003 | ||
| 19 spectra, NWQNVR | 0.000 | 0.044 | 0.000 | 0.696 | 0.067 | 0.111 | 0.082 | 0.000 | ||
| 2 spectra, FSVCVLGDQQHCDEAK | 0.000 | 0.000 | 0.040 | 0.883 | 0.000 | 0.000 | 0.059 | 0.017 | ||
| 13 spectra, NYDPQK | 0.000 | 0.007 | 0.026 | 0.924 | 0.000 | 0.000 | 0.042 | 0.000 | ||
| 6 spectra, FLETVELQISLK | 0.000 | 0.000 | 0.121 | 0.728 | 0.000 | 0.000 | 0.150 | 0.000 | ||
| 6 spectra, AVDIPHMDIEALK | 0.017 | 0.000 | 0.038 | 0.876 | 0.000 | 0.000 | 0.048 | 0.021 | ||
| 18 spectra, FSGTVR | 0.000 | 0.000 | 0.019 | 0.908 | 0.000 | 0.000 | 0.073 | 0.000 | ||
| 22 spectra, LLGPGLNK | 0.000 | 0.000 | 0.036 | 0.845 | 0.000 | 0.000 | 0.119 | 0.000 | ||
| 42 spectra, STMGKPQR | 0.000 | 0.000 | 0.000 | 0.996 | 0.000 | 0.000 | 0.000 | 0.004 | ||
| 14 spectra, DTLYEAVR | 0.000 | 0.000 | 0.003 | 0.953 | 0.000 | 0.000 | 0.032 | 0.012 | ||
| 5 spectra, VLCLAVAVGHVK | 0.005 | 0.000 | 0.051 | 0.839 | 0.000 | 0.000 | 0.069 | 0.037 | ||
| 1 spectrum, STPGVPK | 0.000 | 0.000 | 0.000 | 0.953 | 0.000 | 0.000 | 0.000 | 0.047 | ||
| 4 spectra, FPSLLTHNENMVAK | 0.000 | 0.000 | 0.183 | 0.680 | 0.013 | 0.000 | 0.124 | 0.000 |
| Plot | Mito | Lyso or Perox | ER | Golgi | PM | Cytosol | Nucleus | ||||||
| Expt B |
10 peptides |
38 spectra |
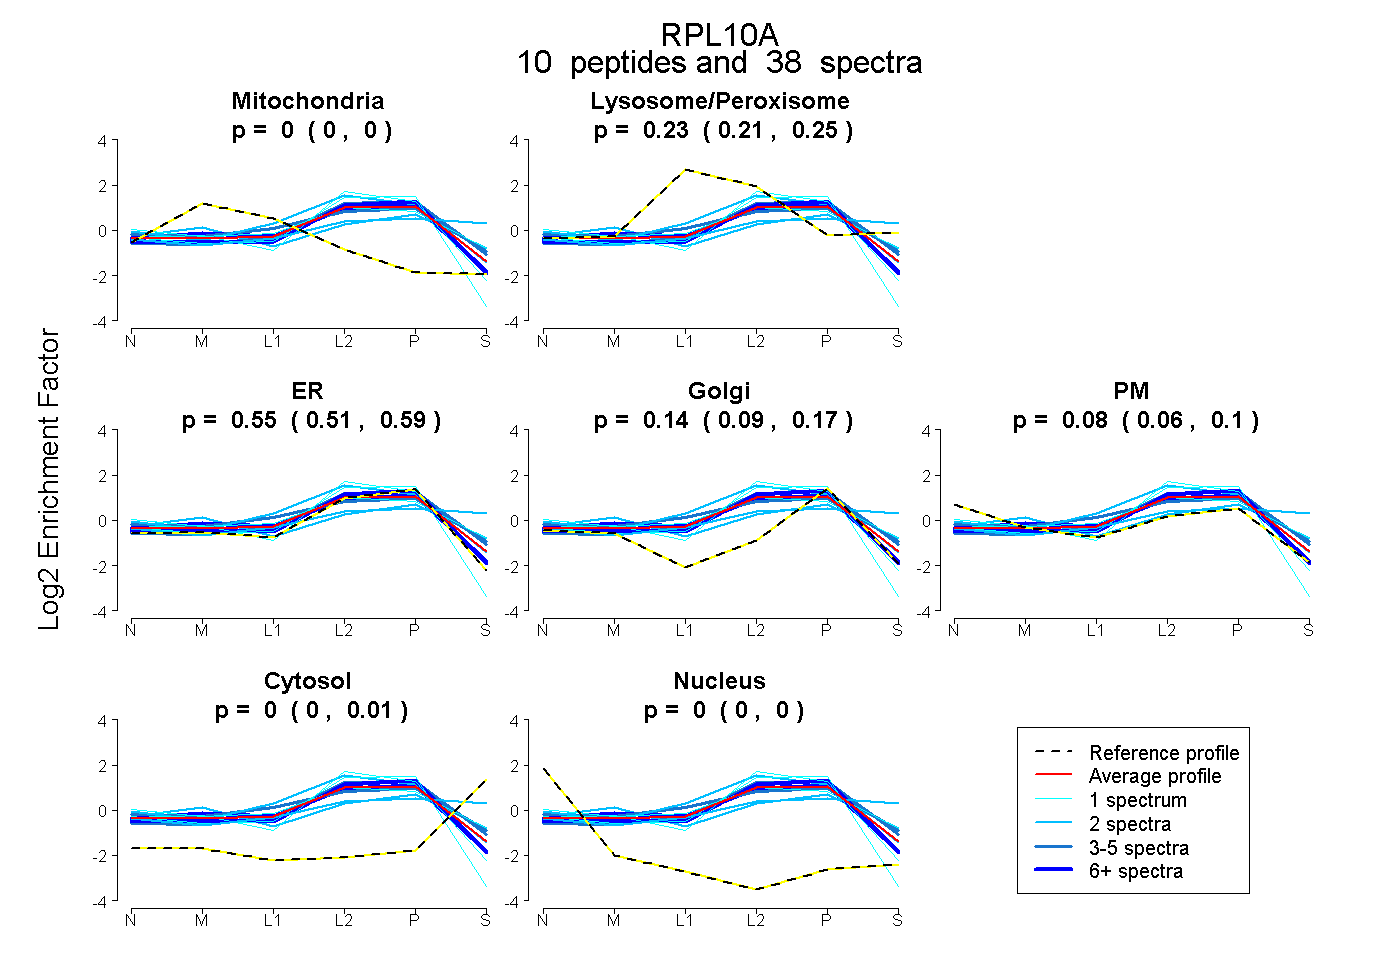 |
0.000 0.000 | 0.000 |
0.233 0.211 | 0.249 |
0.546 0.507 | 0.587 |
0.139 0.089 | 0.170 |
0.079 0.057 | 0.099 |
0.003 0.000 | 0.012 |
0.000 0.000 | 0.000 |
|||
| Plot | Lyso | Other | |||||||||||
| Expt C |
14 peptides |
298 spectra |
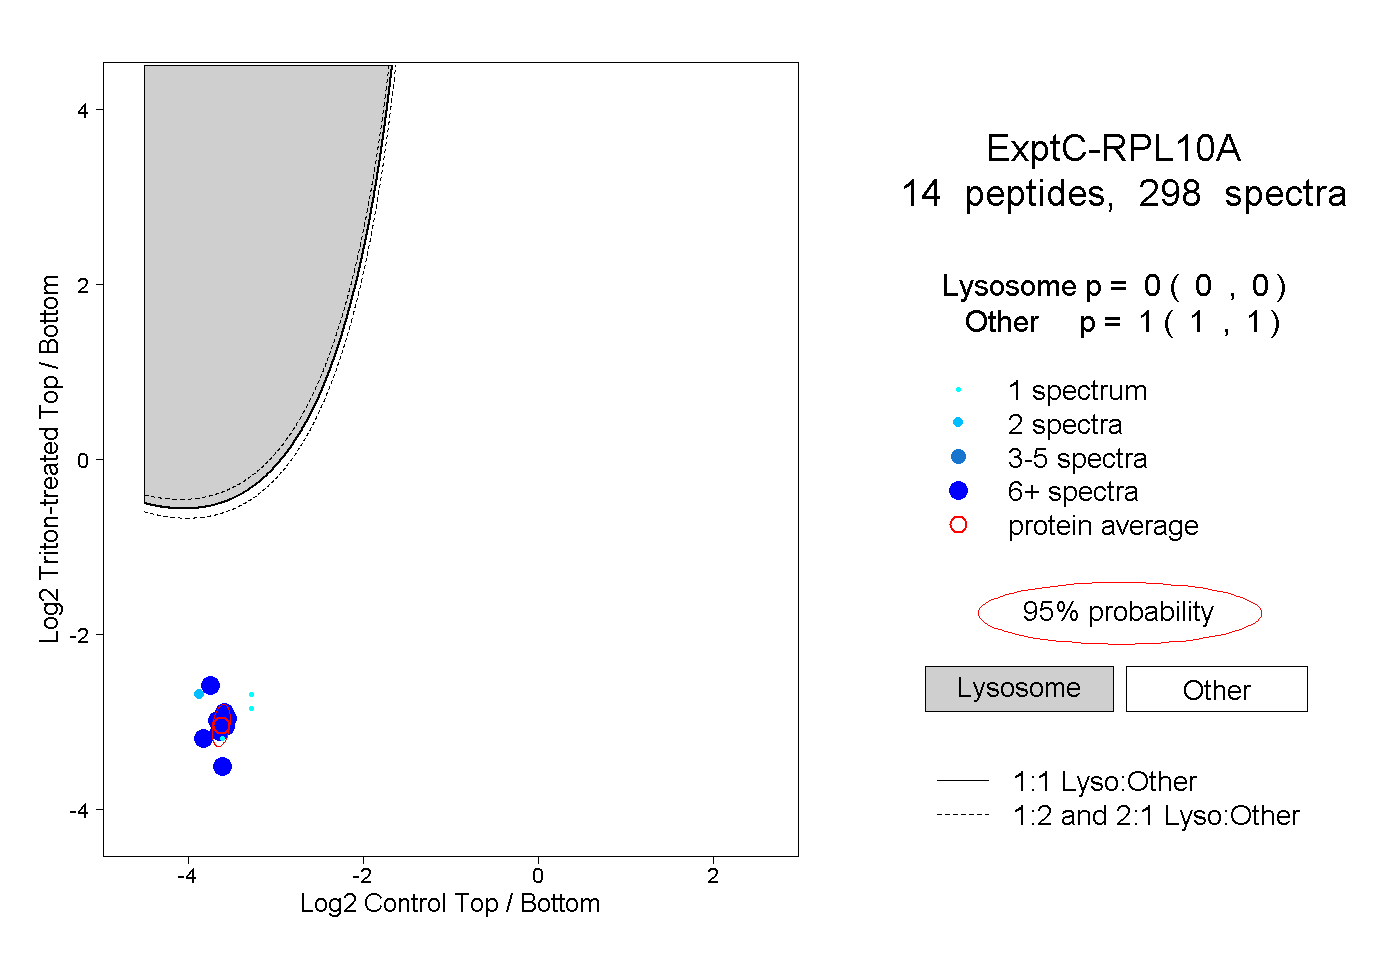 |
0.000 0.000 | 0.000 |
1.000 1.000 | 1.000 |
||||||||
| Plot | Lyso | Other | |||||||||||
| Expt D |
5 peptides |
19 spectra |
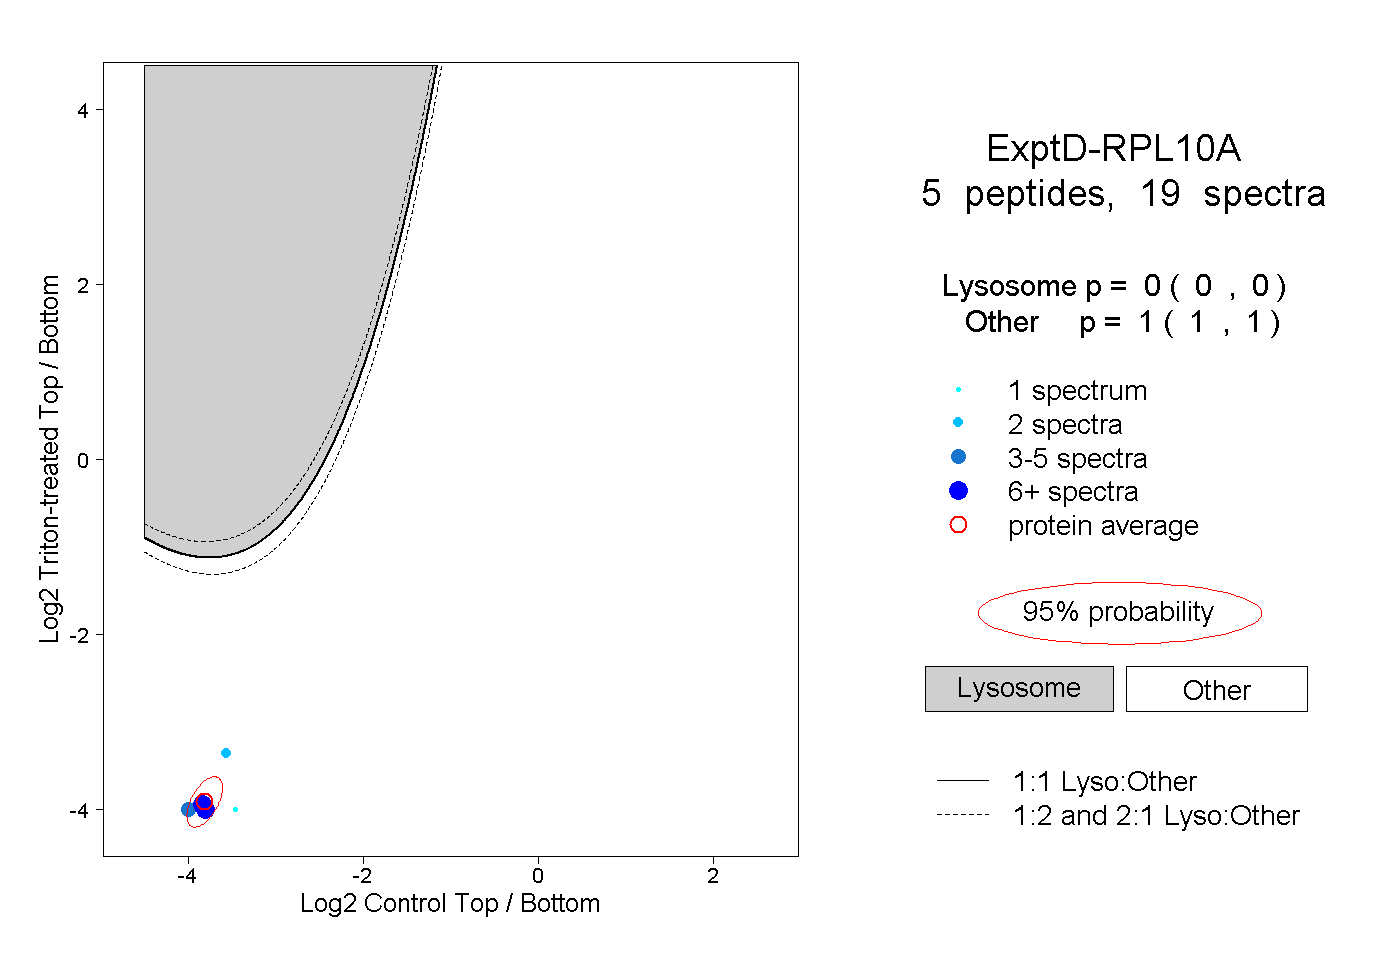 |
0.000 0.000 | 0.000 |
1.000 1.000 | 1.000 |