 1
1peptide
spectra
0.000 | 0.000
0.000 | 0.000
0.000 | 0.019
0.000 | 0.246
0.000 | 0.156
0.000 | 0.245
0.362 | 0.470
0.221 | 0.403
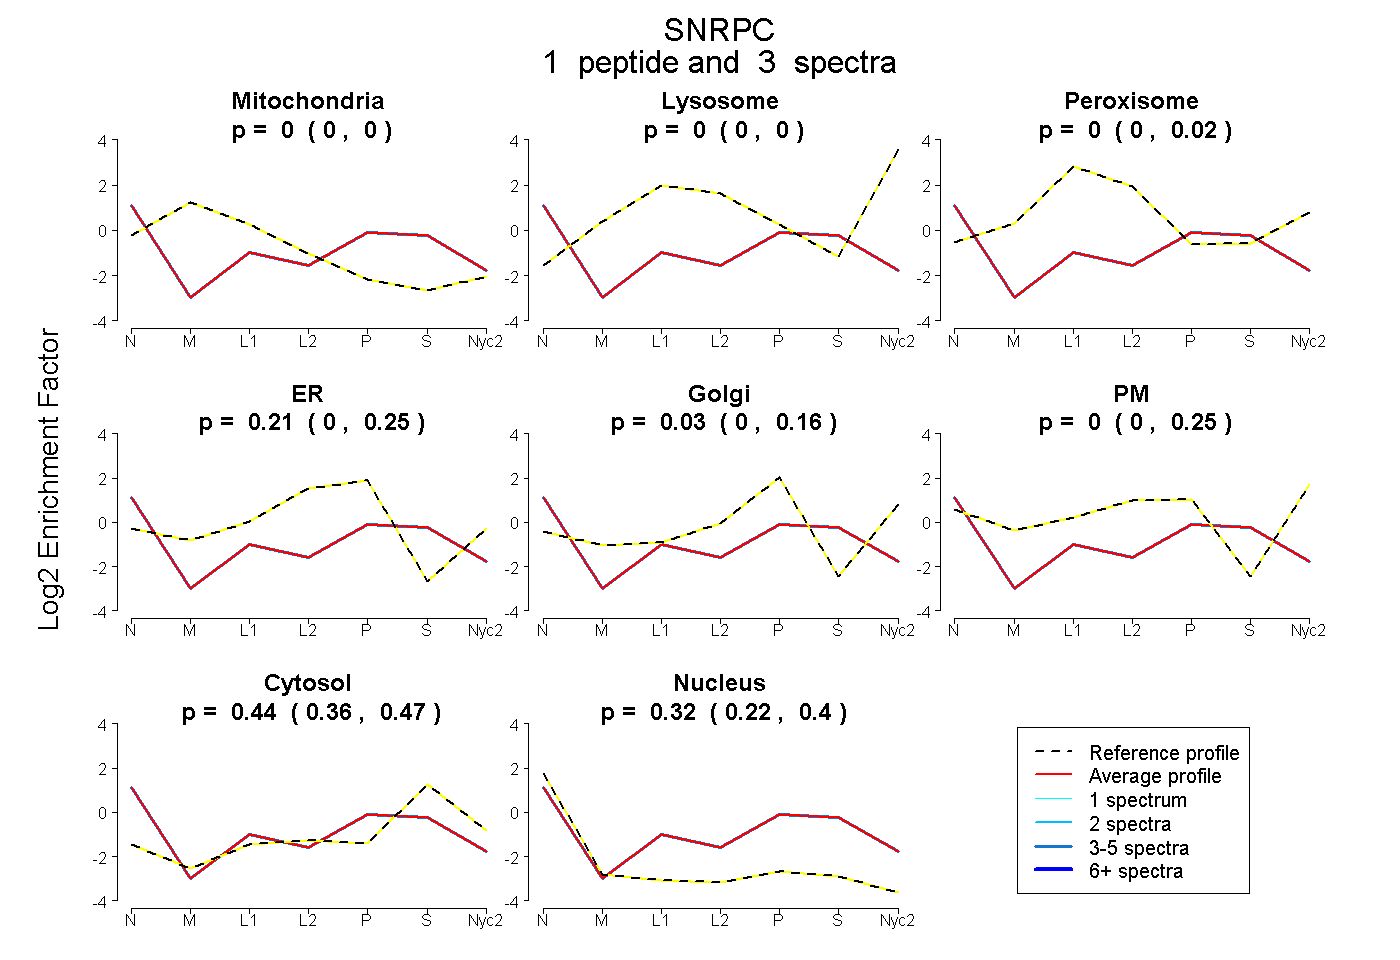
| Plot | Mito | Lyso | Perox | ER | Golgi | PM | Cytosol | Nucleus | |||||
| Expt A |
1 peptide |
3 spectra |
|
0.000 0.000 | 0.000 |
0.000 0.000 | 0.000 |
0.000 0.000 | 0.019 |
0.212 0.000 | 0.246 |
0.029 0.000 | 0.156 |
0.001 0.000 | 0.245 |
0.438 0.362 | 0.470 |
0.319 0.221 | 0.403 |