 2
2peptides
spectra
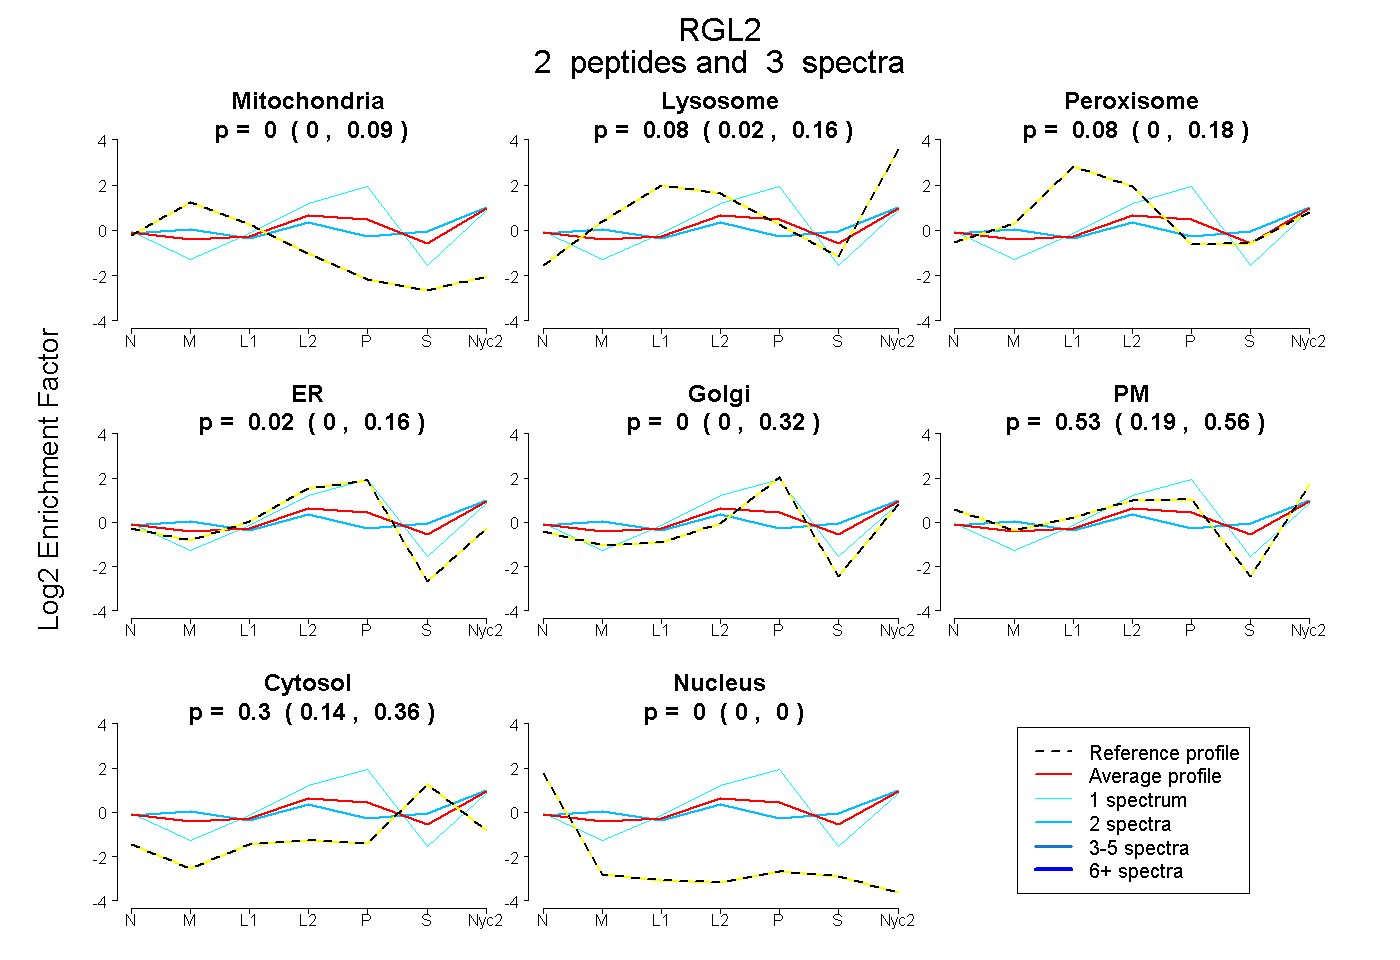
0.000 | 0.086
0.015 | 0.164
0.000 | 0.178
0.000 | 0.159
0.000 | 0.318
0.187 | 0.556
0.143 | 0.365
0.000 | 0.000
1peptide
spectrum
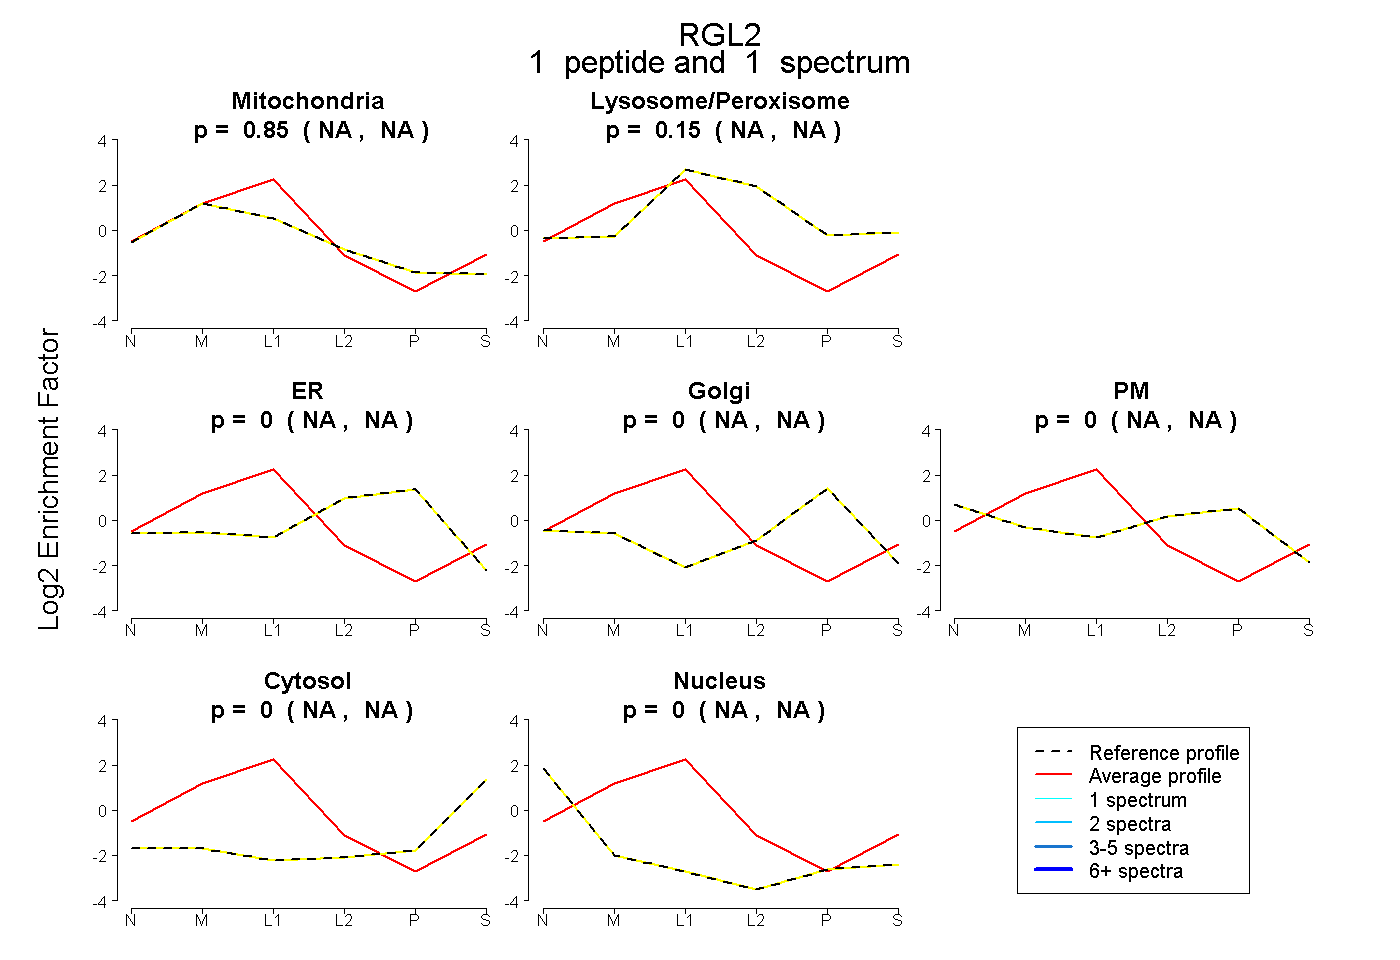
NA | NA
NA | NA
NA | NA
NA | NA
NA | NA
NA | NA
NA | NA
2peptides
spectra
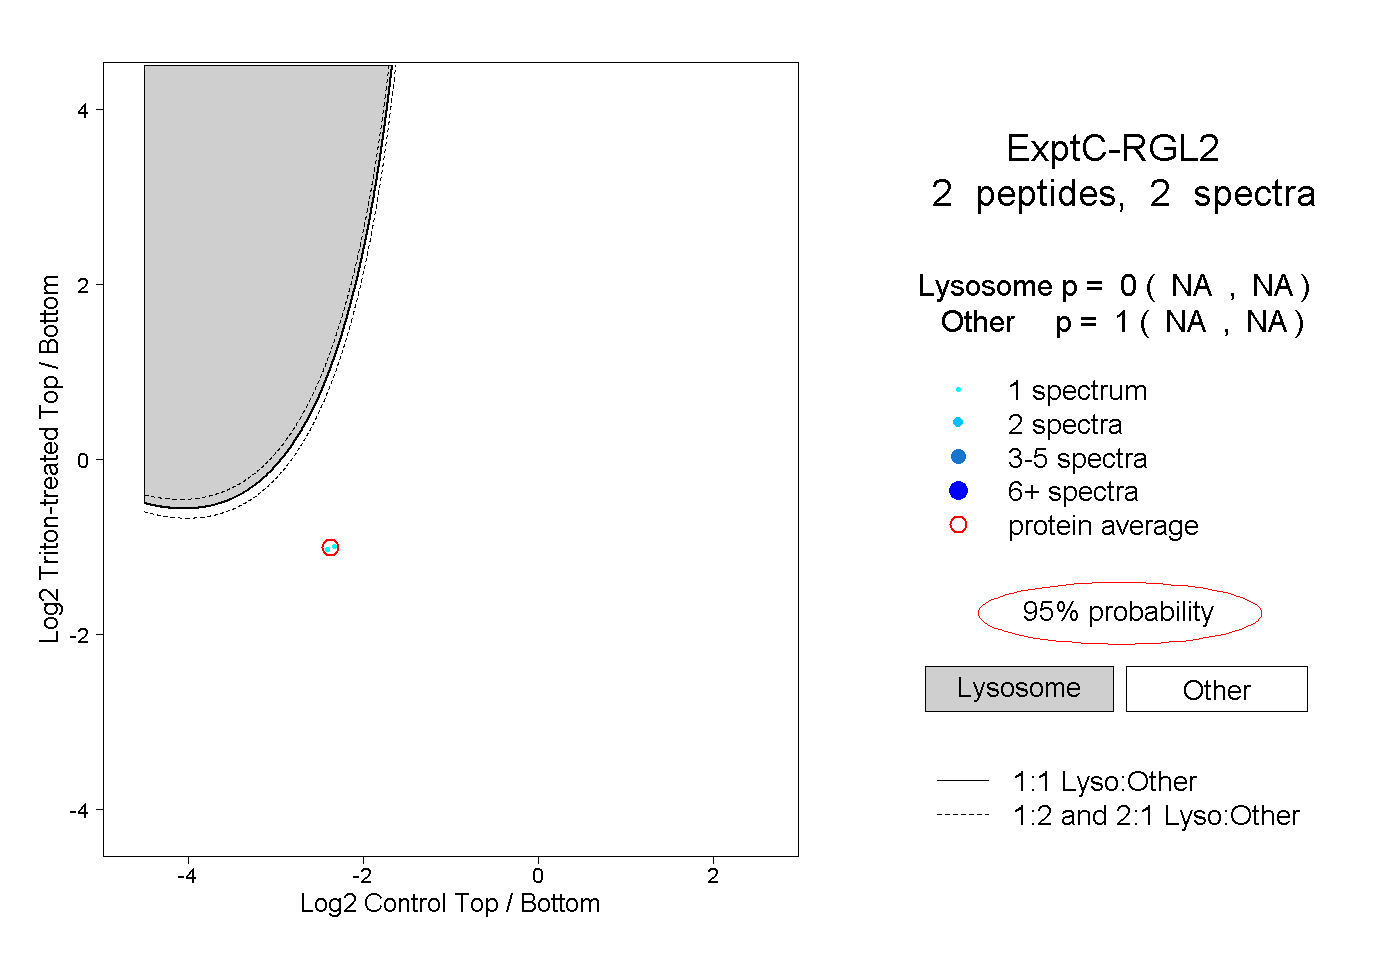
NA | NA
NA | NA
1peptide
spectrum
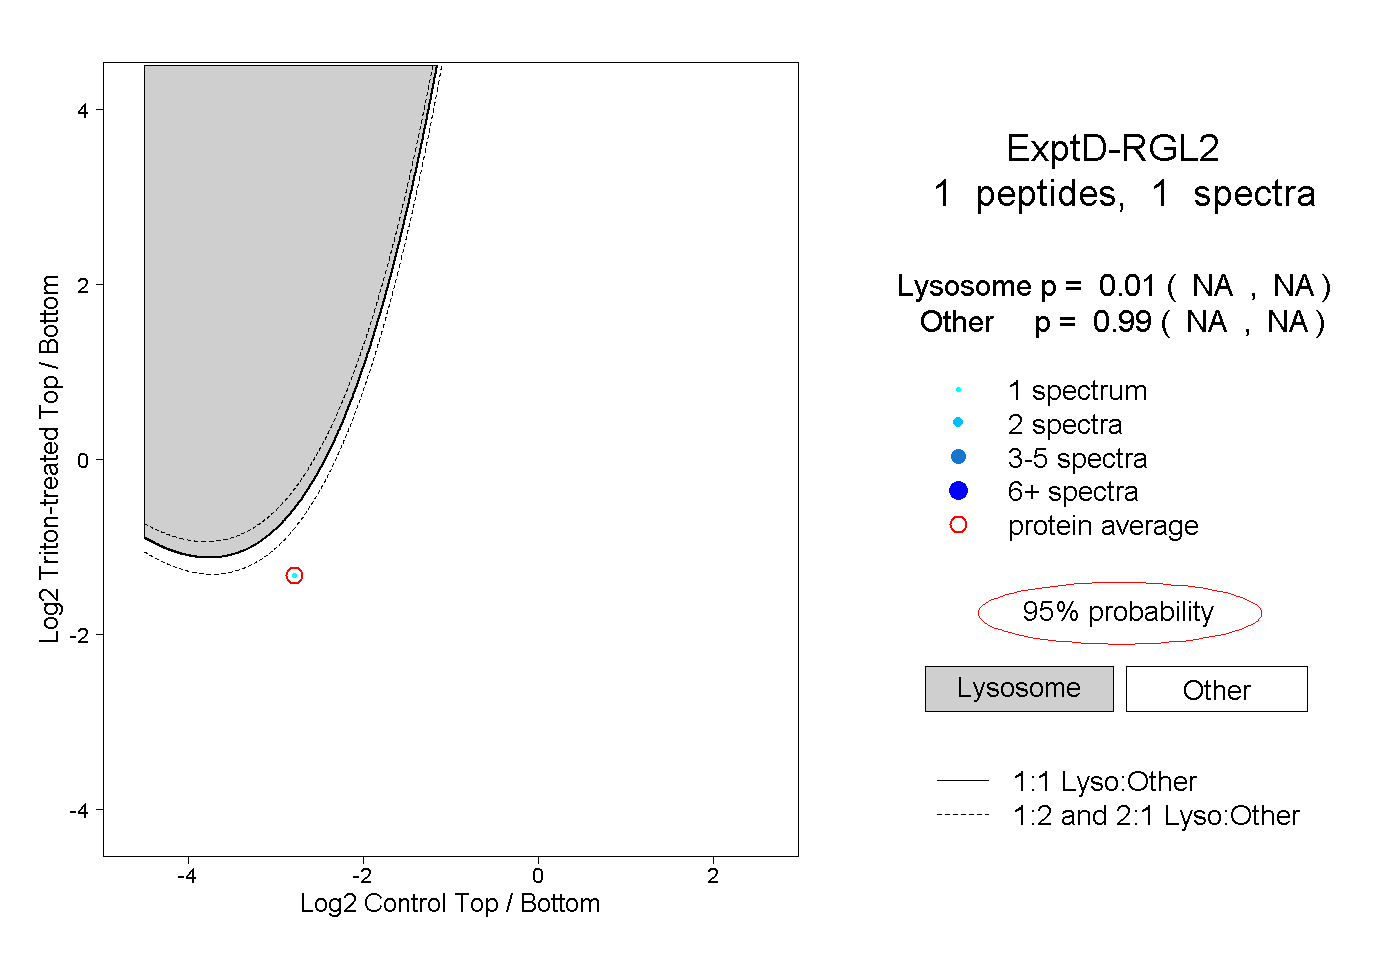
NA | NA
NA | NA