 2
2peptides
spectra
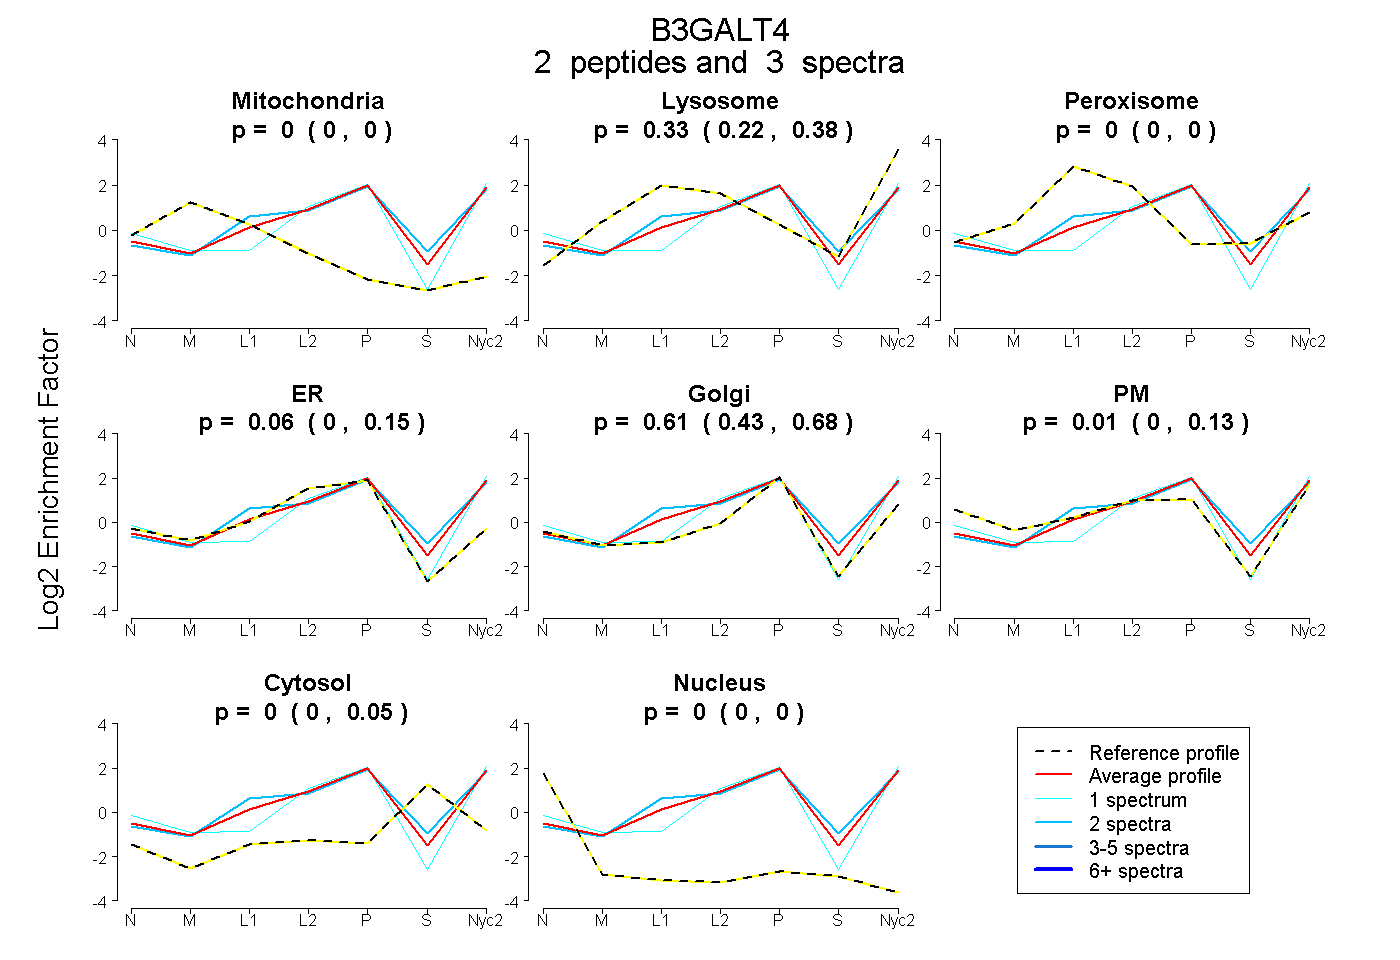
0.000 | 0.000
0.223 | 0.378
0.000 | 0.000
0.000 | 0.152
0.429 | 0.682
0.000 | 0.135
0.000 | 0.049
0.000 | 0.000
| Plot | Mito | Lyso | Perox | ER | Golgi | PM | Cytosol | Nucleus | |||||
| Expt A |
2 peptides |
3 spectra |
|
0.000 0.000 | 0.000 |
0.328 0.223 | 0.378 |
0.000 0.000 | 0.000 |
0.060 0.000 | 0.152 |
0.607 0.429 | 0.682 |
0.005 0.000 | 0.135 |
0.000 0.000 | 0.049 |
0.000 0.000 | 0.000 |
| 1 spectrum, FLLTSHK | 0.000 | 0.059 | 0.000 | 0.000 | 0.553 | 0.388 | 0.000 | 0.000 | ||
| 2 spectra, GQAVPLLYLGR | 0.000 | 0.396 | 0.000 | 0.108 | 0.435 | 0.000 | 0.062 | 0.000 |
| Plot | Lyso | Other | |||||||||||
| Expt C |
2 peptides |
5 spectra |
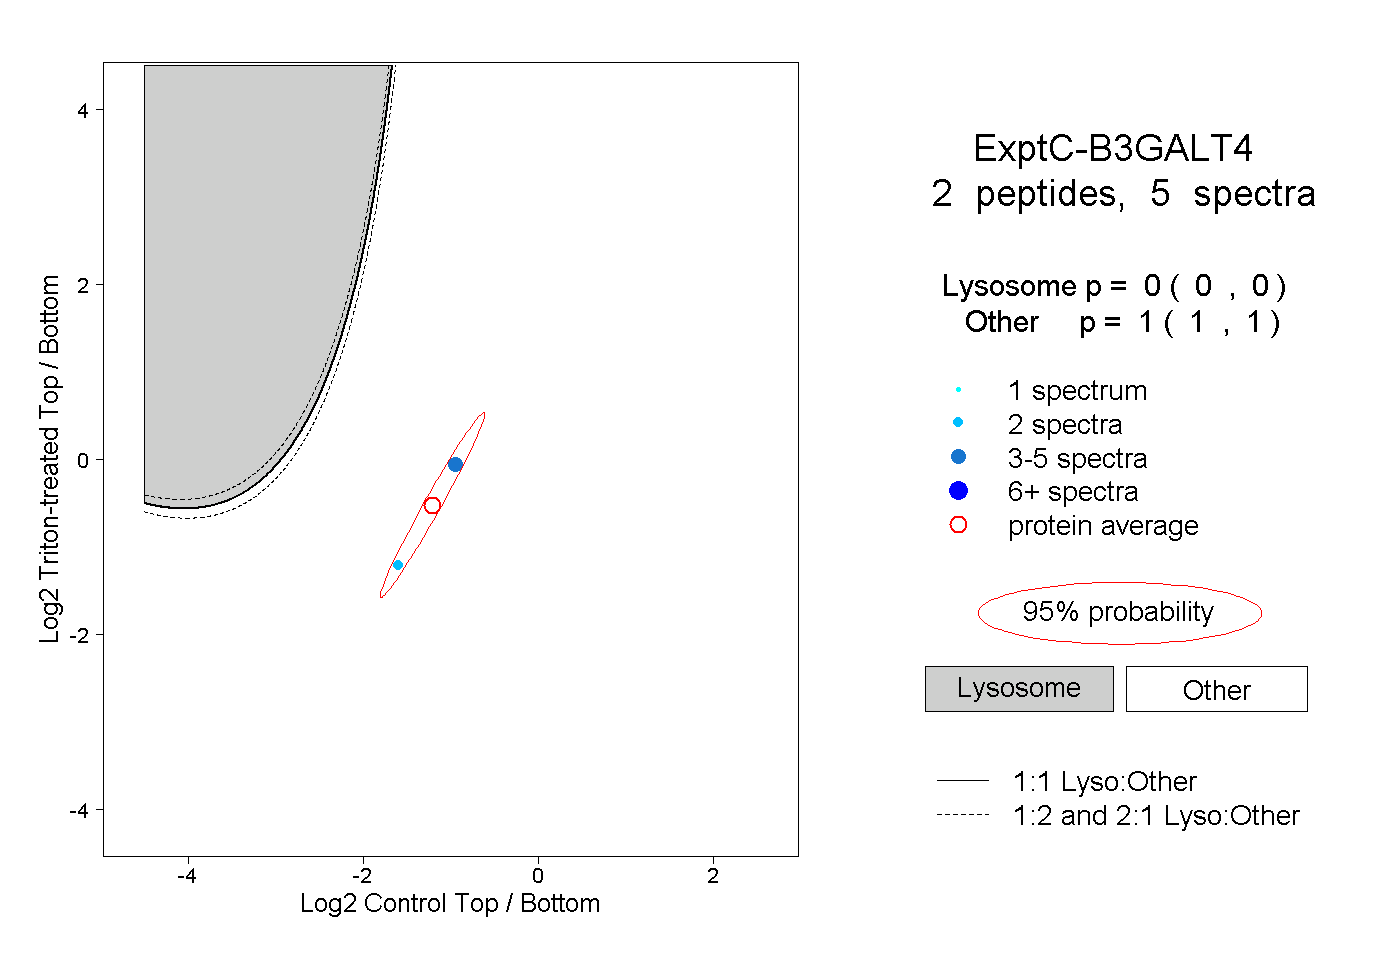 |
0.000 0.000 | 0.000 |
1.000 1.000 | 1.000 |