6
6peptides
spectra
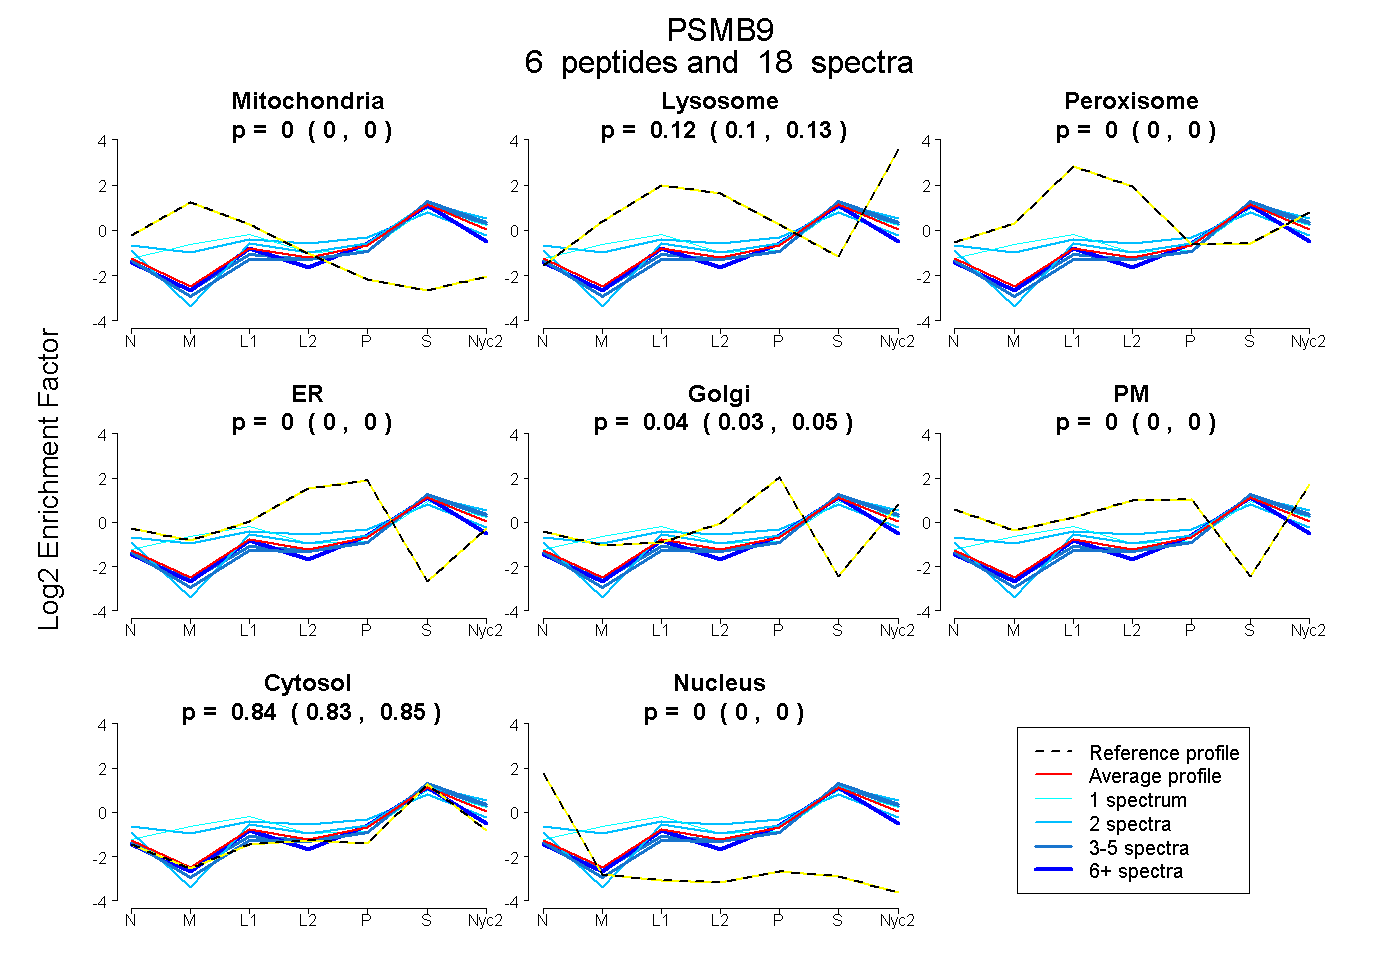
0.000 | 0.000
0.100 | 0.130
0.000 | 0.000
0.000 | 0.000
0.028 | 0.052
0.000 | 0.000
0.831 | 0.852
0.000 | 0.000
4peptides
spectra
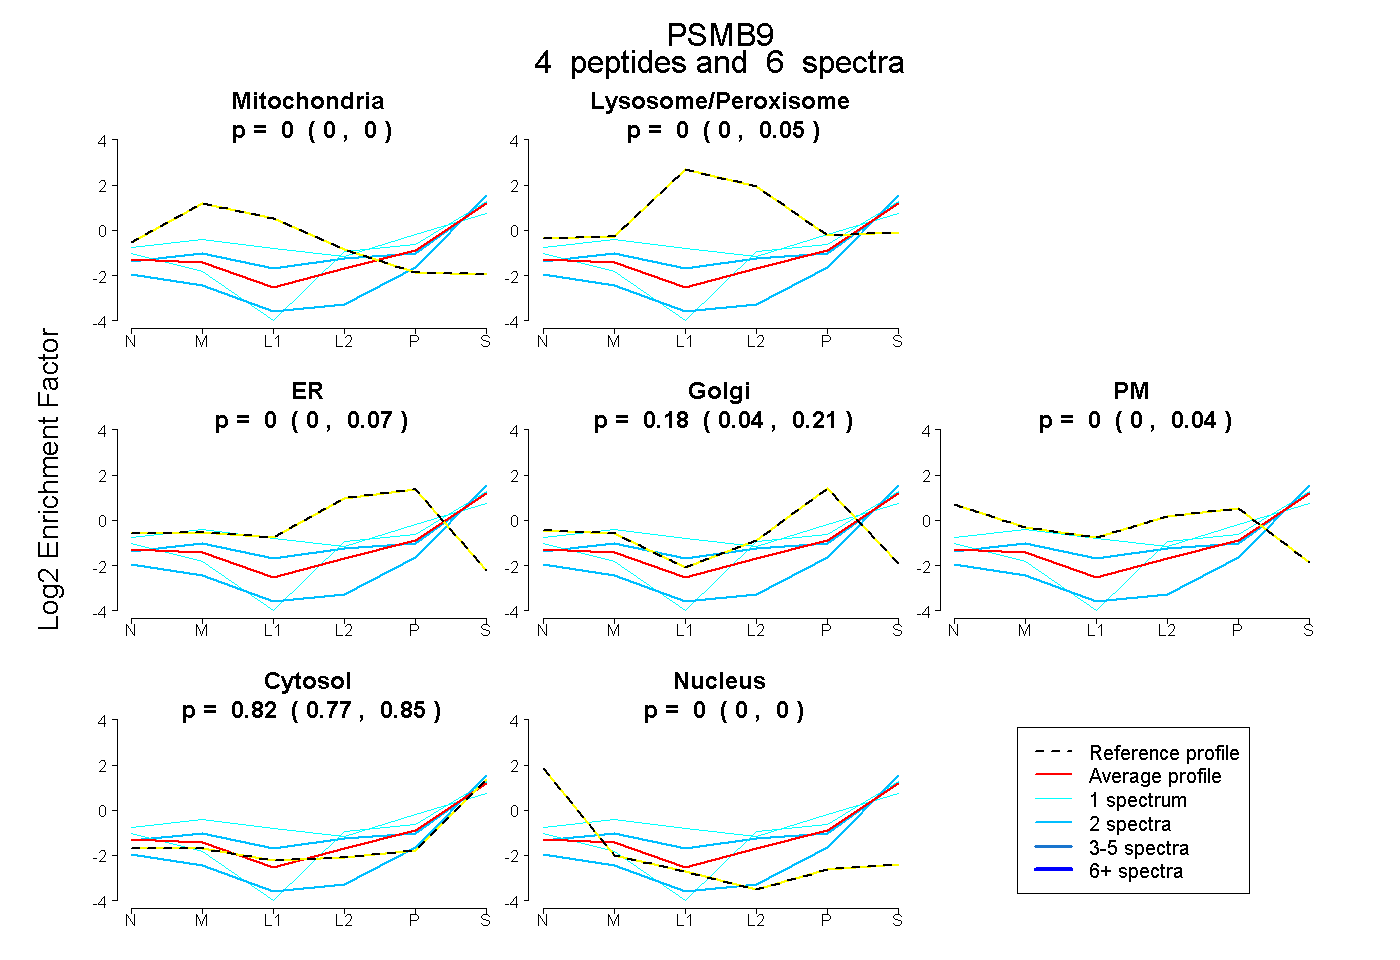
0.000 | 0.000
0.000 | 0.047
0.000 | 0.075
0.039 | 0.212
0.000 | 0.044
0.770 | 0.853
0.000 | 0.000