 6
6peptides
spectra
0.000 | 0.000
0.100 | 0.130
0.000 | 0.000
0.000 | 0.000
0.028 | 0.052
0.000 | 0.000
0.831 | 0.852
0.000 | 0.000
| Plot | Mito | Lyso | Perox | ER | Golgi | PM | Cytosol | Nucleus | |||||
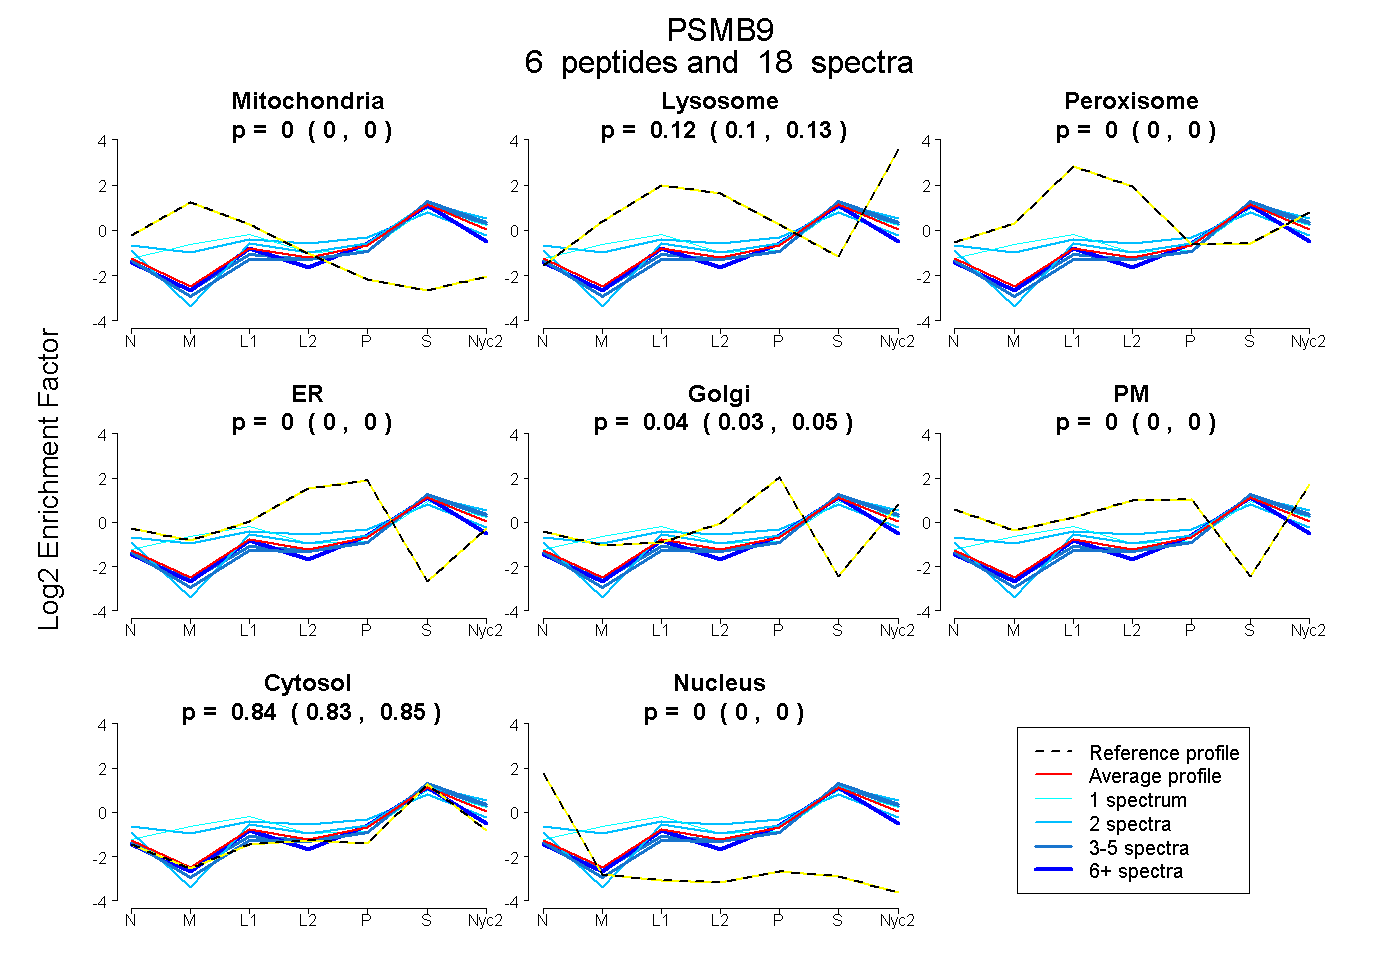
| Expt A |
6 peptides |
18 spectra |
|
0.000 0.000 | 0.000 |
0.116 0.100 | 0.130 |
0.000 0.000 | 0.000 |
0.000 0.000 | 0.000 |
0.041 0.028 | 0.052 |
0.000 0.000 | 0.000 |
0.843 0.831 | 0.852 |
0.000 0.000 | 0.000 |
| 3 spectra, VSAGAAVVNR | 0.000 | 0.091 | 0.000 | 0.000 | 0.004 | 0.000 | 0.904 | 0.000 | ||
| 2 spectra, DGSSGGVIYLVTITADGVDHR | 0.013 | 0.000 | 0.239 | 0.000 | 0.147 | 0.004 | 0.598 | 0.000 | ||
| 2 spectra, VILGDELPK | 0.000 | 0.128 | 0.000 | 0.000 | 0.009 | 0.033 | 0.830 | 0.000 | ||
| 1 spectrum, FTTDAITLAMNR | 0.098 | 0.234 | 0.036 | 0.000 | 0.000 | 0.000 | 0.632 | 0.000 | ||
| 3 spectra, EGGQVYGTMGGMLIR | 0.000 | 0.116 | 0.000 | 0.000 | 0.000 | 0.000 | 0.884 | 0.000 | ||
| 7 spectra, LSPLHQR | 0.000 | 0.019 | 0.000 | 0.000 | 0.087 | 0.000 | 0.894 | 0.000 |
| Plot | Mito | Lyso or Perox | ER | Golgi | PM | Cytosol | Nucleus | ||||||
| Expt B |
4 peptides |
6 spectra |
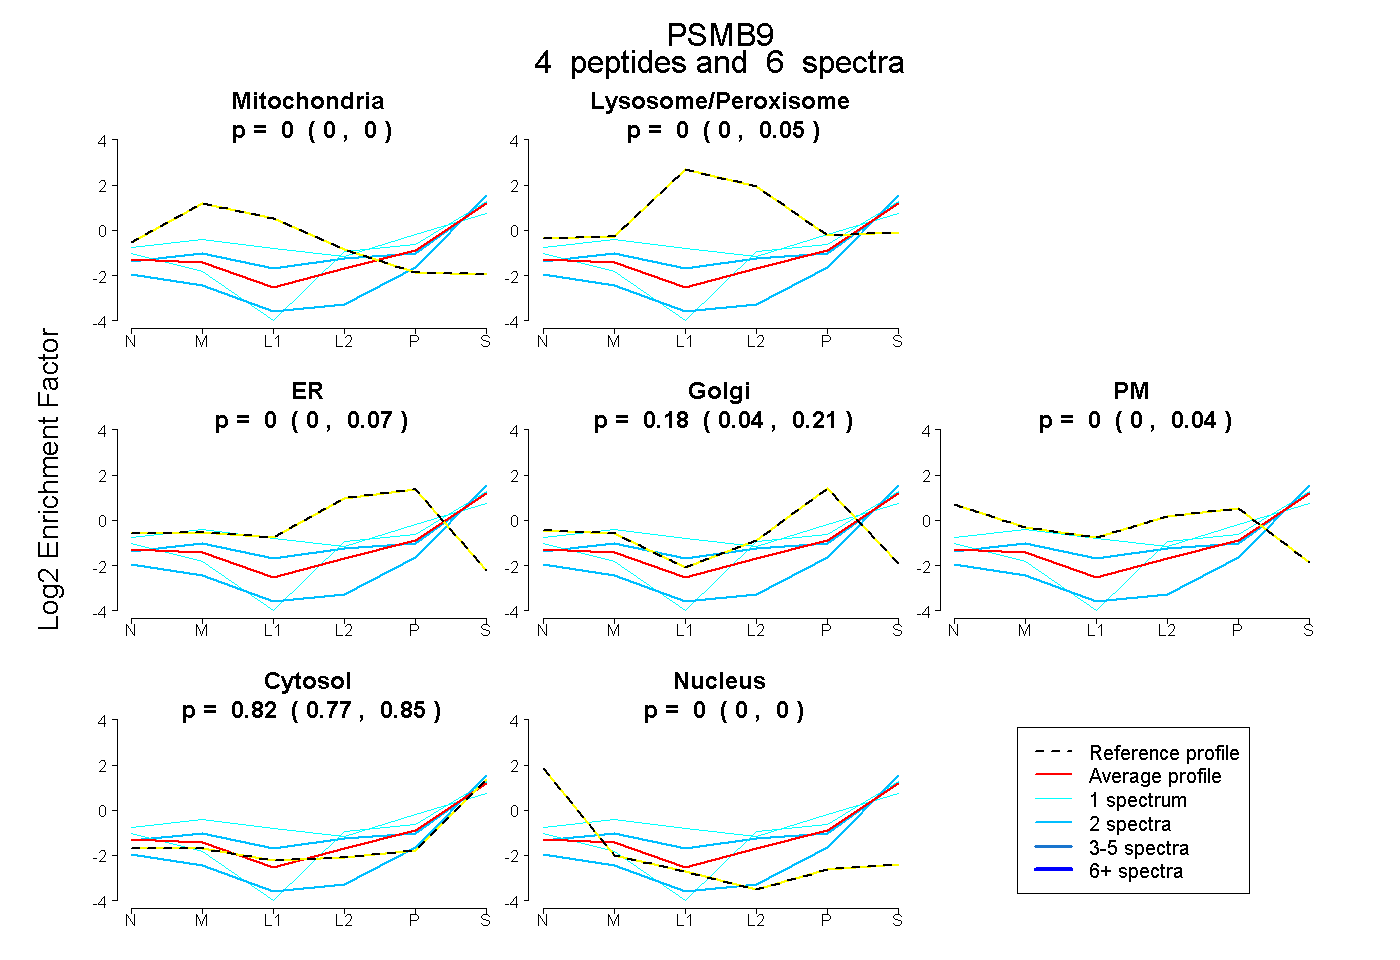 |
0.000 0.000 | 0.000 |
0.000 0.000 | 0.047 |
0.000 0.000 | 0.075 |
0.183 0.039 | 0.212 |
0.000 0.000 | 0.044 |
0.817 0.770 | 0.853 |
0.000 0.000 | 0.000 |
|||
| Plot | Lyso | Other | |||||||||||
| Expt C |
4 peptides |
13 spectra |
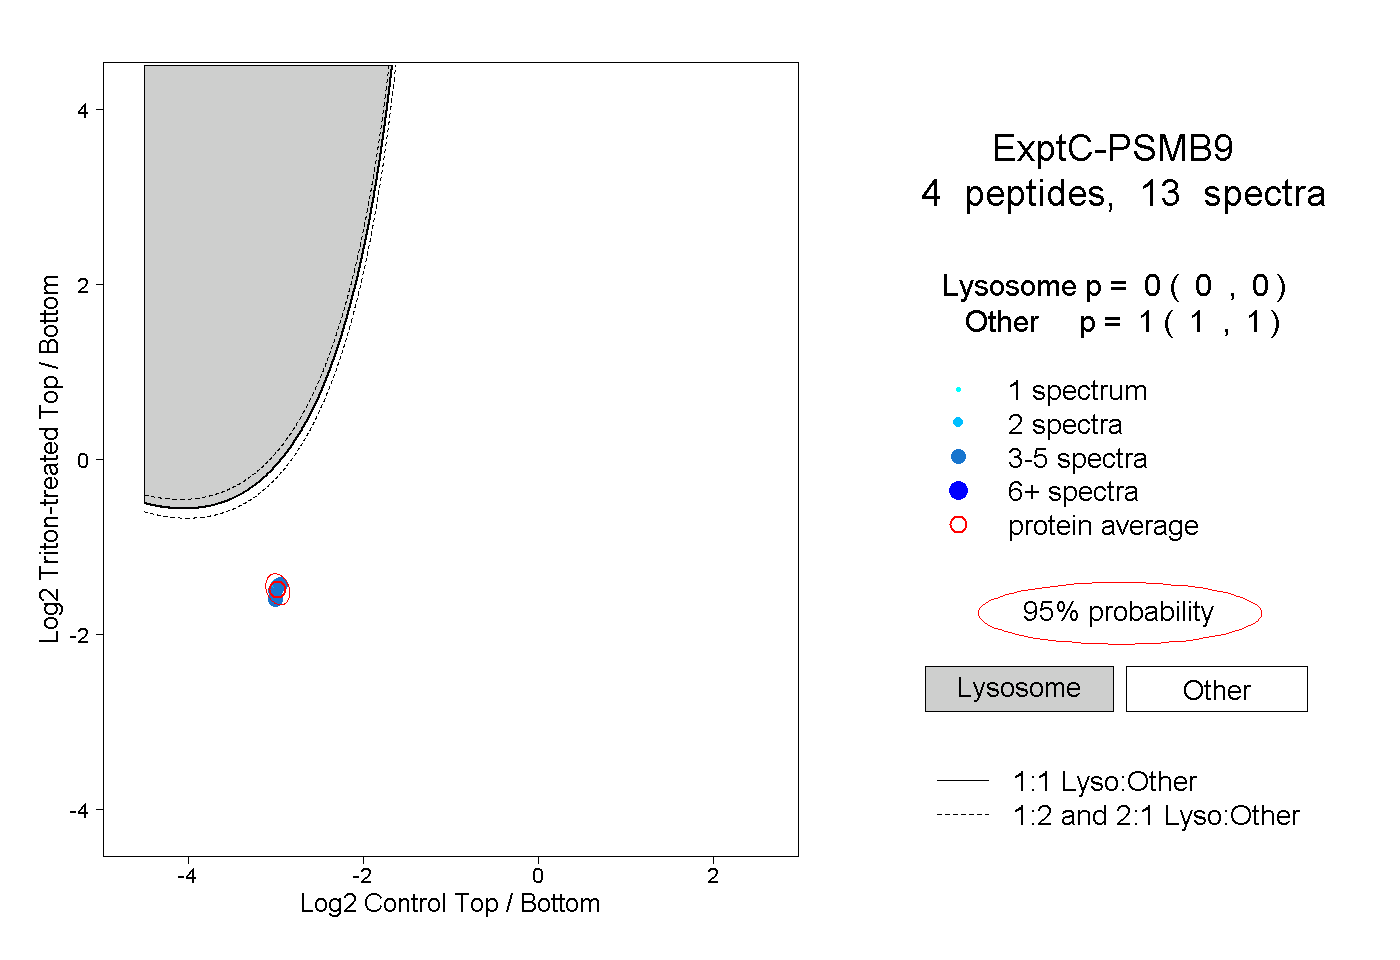 |
0.000 0.000 | 0.000 |
1.000 1.000 | 1.000 |
||||||||
| Plot | Lyso | Other | |||||||||||
| Expt D |
1 peptide |
2 spectra |
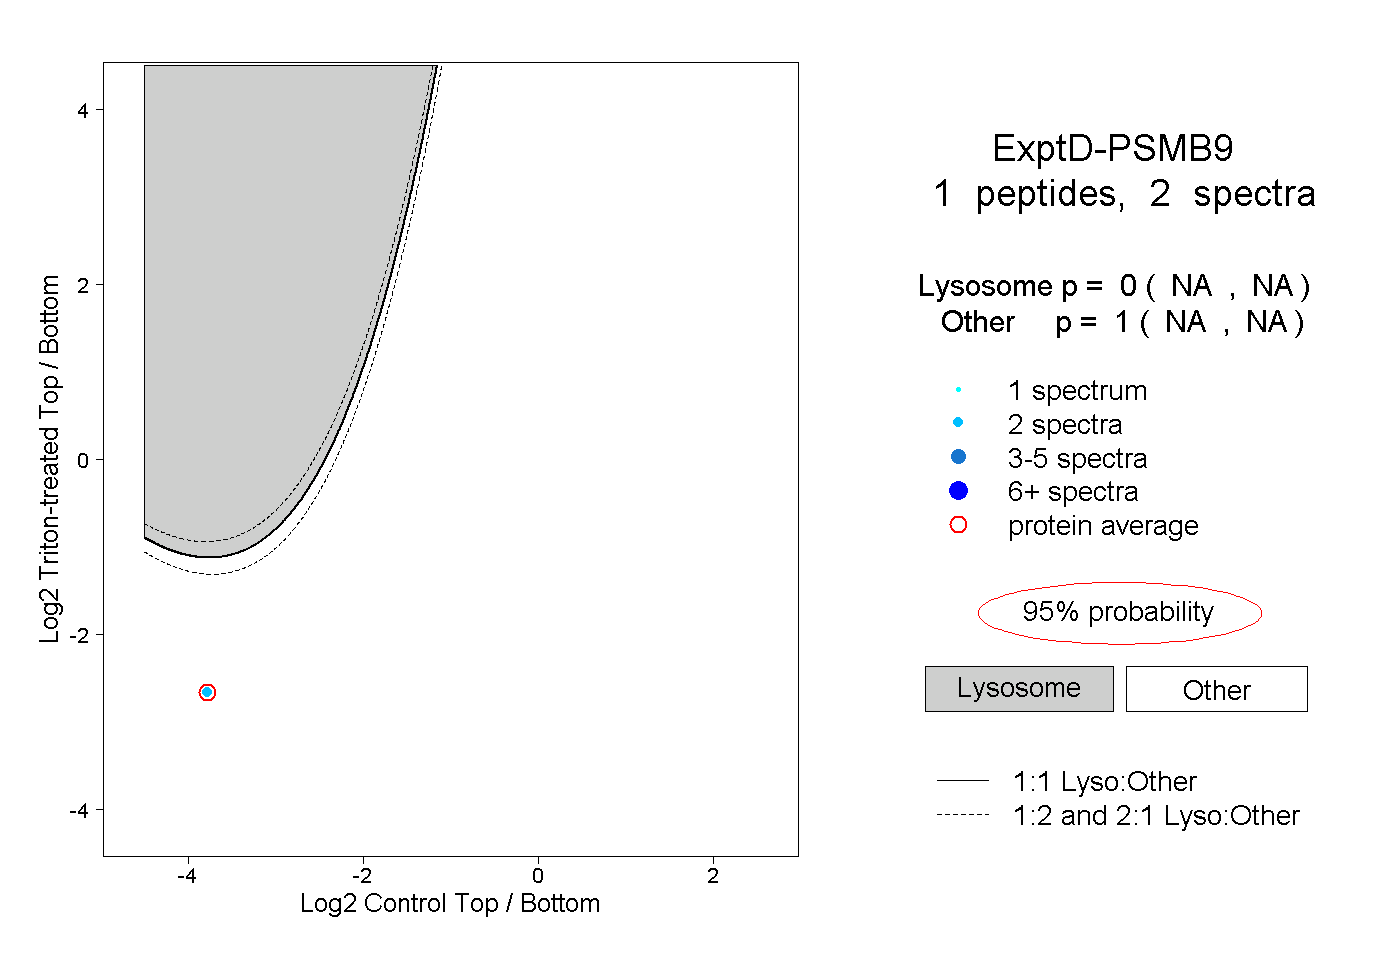 |
0.000 NA | NA |
1.000 NA | NA |