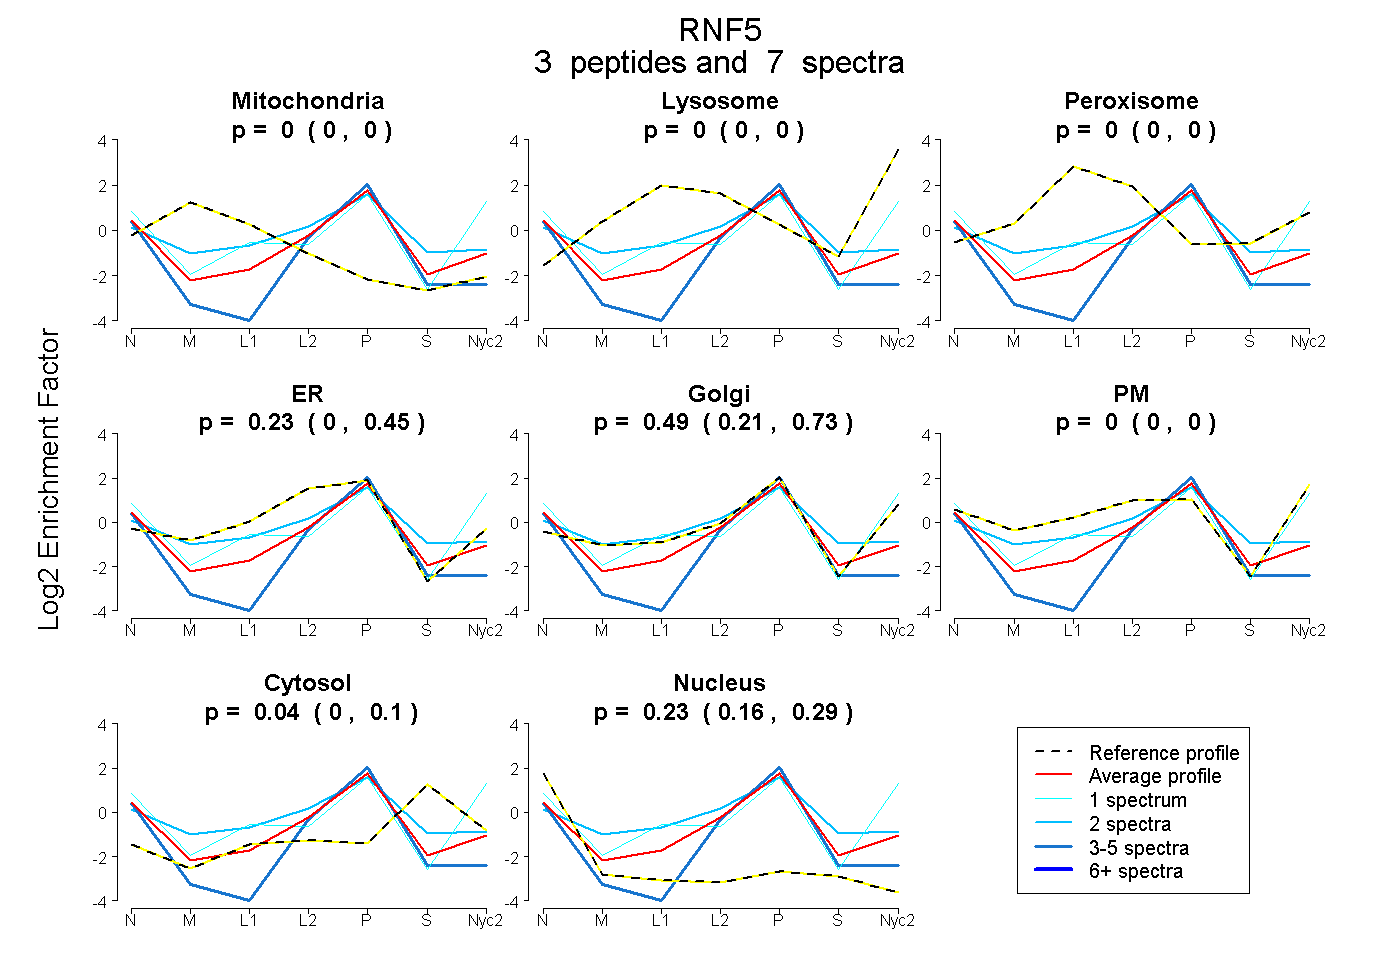
 3
3peptides
spectra
0.000 | 0.000
0.000 | 0.000
0.000 | 0.000
0.000 | 0.446
0.205 | 0.726
0.000 | 0.000
0.000 | 0.100
0.159 | 0.287
1peptide
spectrum
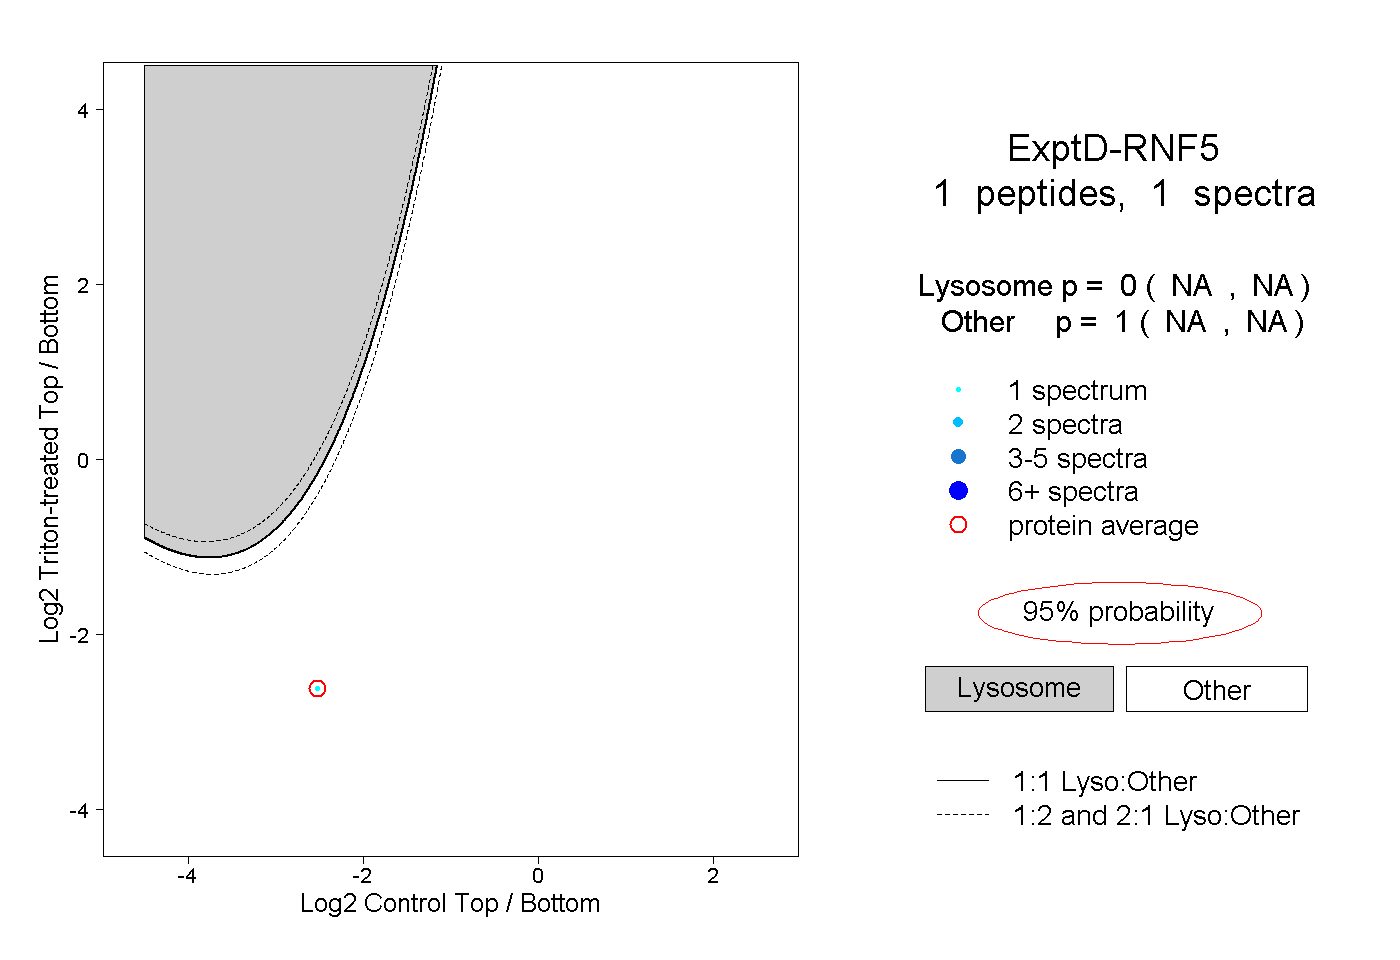
NA | NA
NA | NA
| Plot | Mito | Lyso | Perox | ER | Golgi | PM | Cytosol | Nucleus | |||||
| Expt A |
3 peptides |
7 spectra |
|
0.000 0.000 | 0.000 |
0.000 0.000 | 0.000 |
0.000 0.000 | 0.000 |
0.234 0.000 | 0.446 |
0.494 0.205 | 0.726 |
0.000 0.000 | 0.000 |
0.040 0.000 | 0.100 |
0.232 0.159 | 0.287 |
||
| Plot | Lyso | Other | |||||||||||
| Expt D |
1 peptide |
1 spectrum |
|
0.000 NA | NA |
1.000 NA | NA |