 10
10peptides
spectra
0.000 | 0.000
0.102 | 0.111
0.000 | 0.000
0.000 | 0.000
0.000 | 0.000
0.000 | 0.000
0.888 | 0.898
0.000 | 0.000
| Plot | Mito | Lyso | Perox | ER | Golgi | PM | Cytosol | Nucleus | |||||
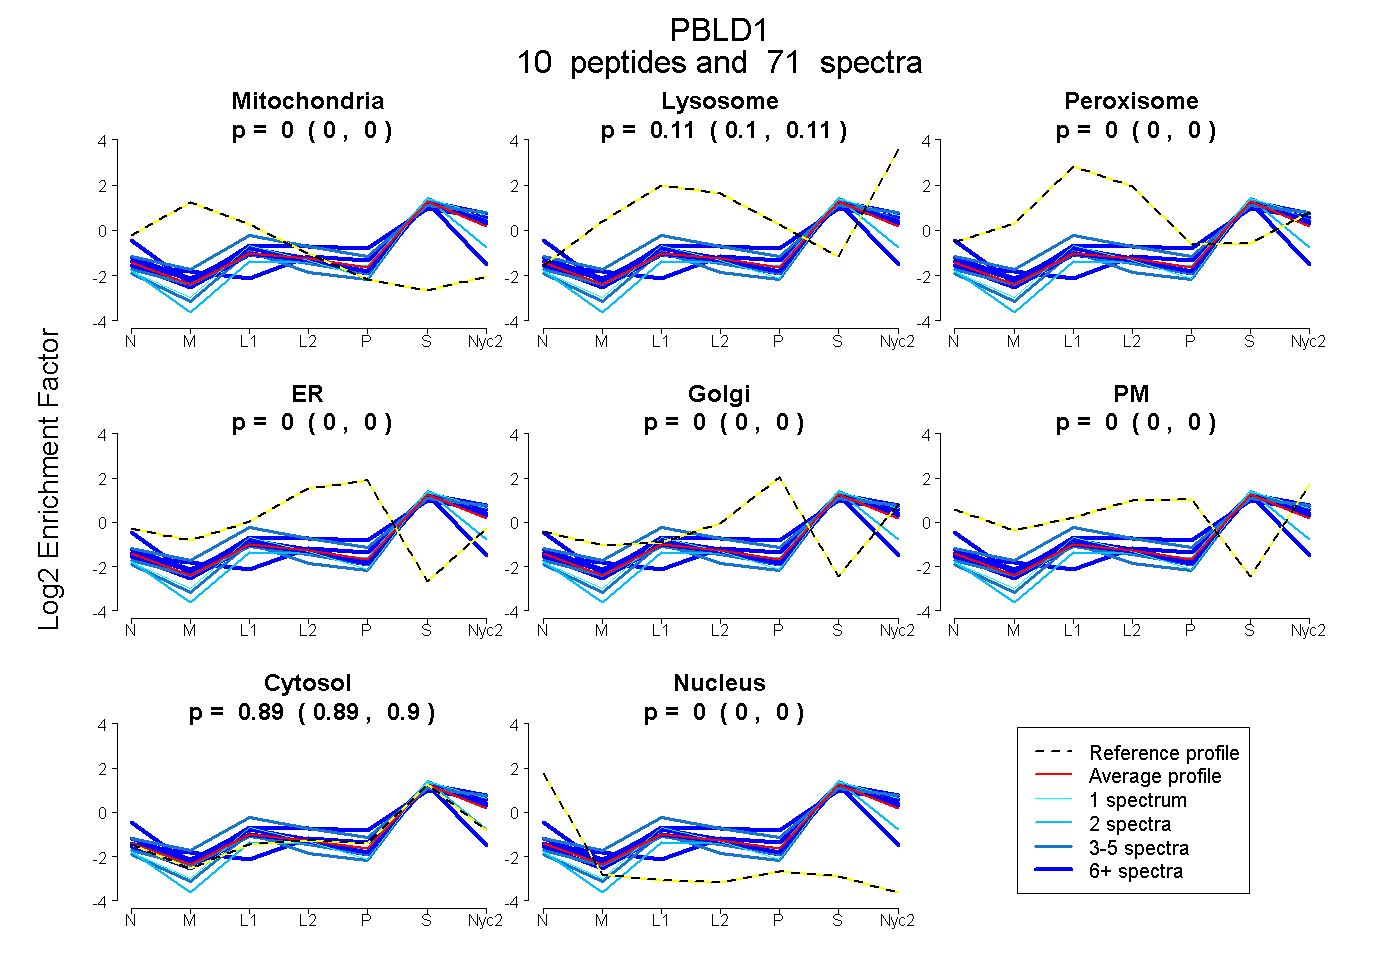
| Expt A |
10 peptides |
71 spectra |
|
0.000 0.000 | 0.000 |
0.107 0.102 | 0.111 |
0.000 0.000 | 0.000 |
0.000 0.000 | 0.000 |
0.000 0.000 | 0.000 |
0.000 0.000 | 0.000 |
0.893 0.888 | 0.898 |
0.000 0.000 | 0.000 |
| 7 spectra, AFQCSCR | 0.050 | 0.000 | 0.000 | 0.000 | 0.000 | 0.000 | 0.921 | 0.029 | ||
| 23 spectra, EMNLSETAFIR | 0.000 | 0.170 | 0.000 | 0.000 | 0.000 | 0.000 | 0.830 | 0.000 | ||
| 3 spectra, VNTEPLPGIEK | 0.000 | 0.282 | 0.000 | 0.000 | 0.000 | 0.000 | 0.718 | 0.000 | ||
| 2 spectra, LQPTDSFSQSSCFGLR | 0.000 | 0.000 | 0.000 | 0.000 | 0.000 | 0.000 | 1.000 | 0.000 | ||
| 11 spectra, LSDSYDR | 0.000 | 0.127 | 0.000 | 0.000 | 0.000 | 0.000 | 0.873 | 0.000 | ||
| 1 spectrum, SFLESLK | 0.000 | 0.108 | 0.000 | 0.000 | 0.000 | 0.000 | 0.892 | 0.000 | ||
| 4 spectra, GLILTVK | 0.000 | 0.098 | 0.000 | 0.000 | 0.000 | 0.000 | 0.902 | 0.000 | ||
| 5 spectra, GESGGQTTPYDFYSR | 0.000 | 0.026 | 0.000 | 0.000 | 0.000 | 0.000 | 0.974 | 0.000 | ||
| 9 spectra, GGELDISLRPDGR | 0.000 | 0.088 | 0.000 | 0.000 | 0.000 | 0.000 | 0.912 | 0.000 | ||
| 6 spectra, GGAAVVLEGMLTA | 0.000 | 0.114 | 0.000 | 0.000 | 0.000 | 0.142 | 0.743 | 0.000 |
| Plot | Mito | Lyso or Perox | ER | Golgi | PM | Cytosol | Nucleus | ||||||
| Expt B |
6 peptides |
18 spectra |
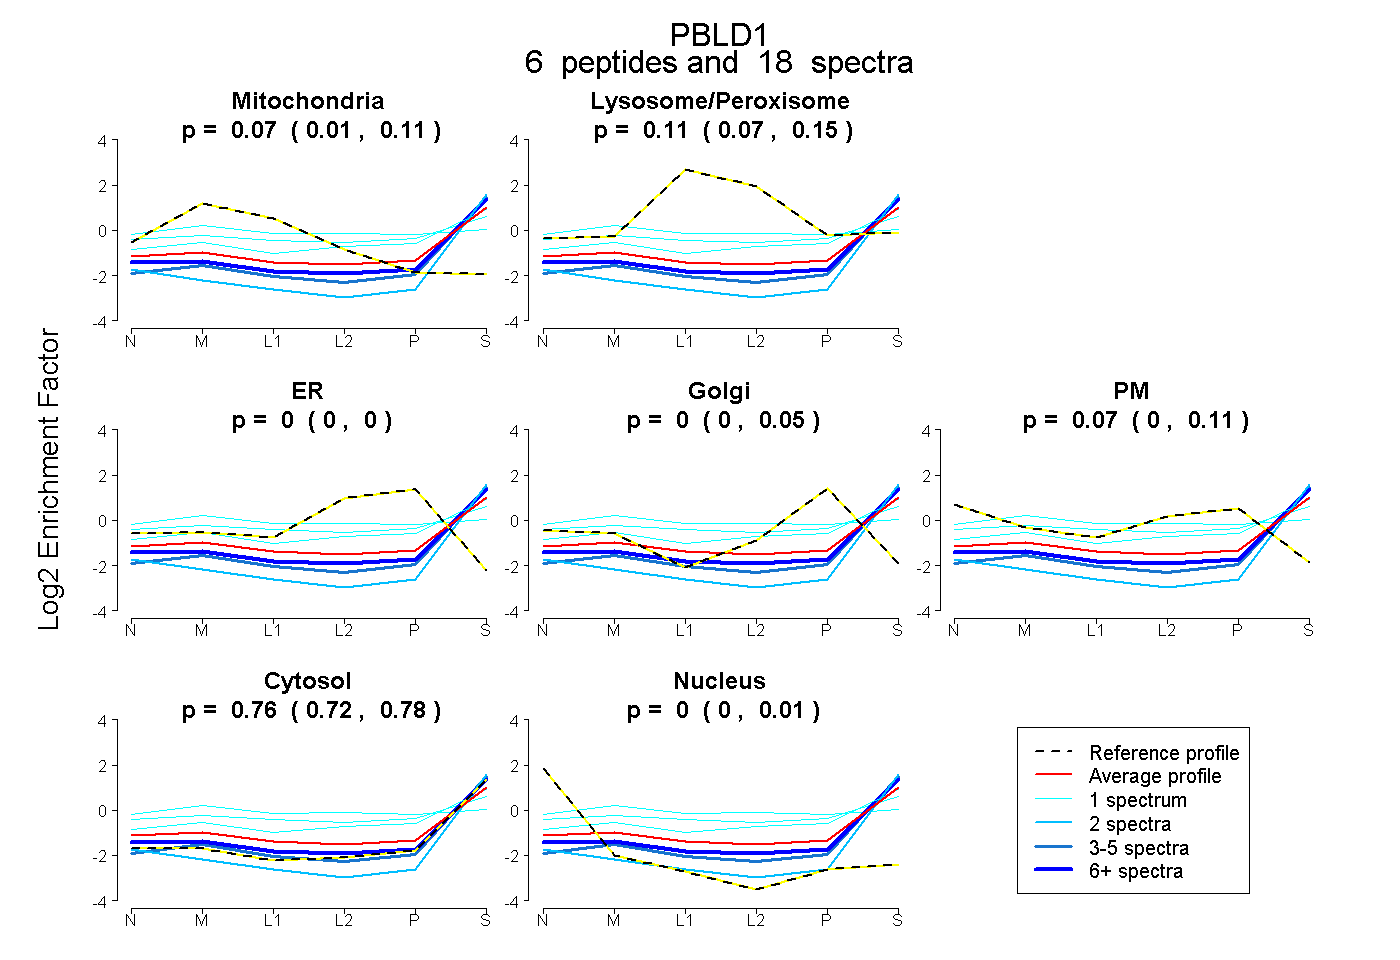 |
0.066 0.011 | 0.113 |
0.107 0.069 | 0.151 |
0.000 0.000 | 0.000 |
0.000 0.000 | 0.054 |
0.071 0.000 | 0.108 |
0.757 0.725 | 0.778 |
0.000 0.000 | 0.015 |
|||
| Plot | Lyso | Other | |||||||||||
| Expt C |
10 peptides |
97 spectra |
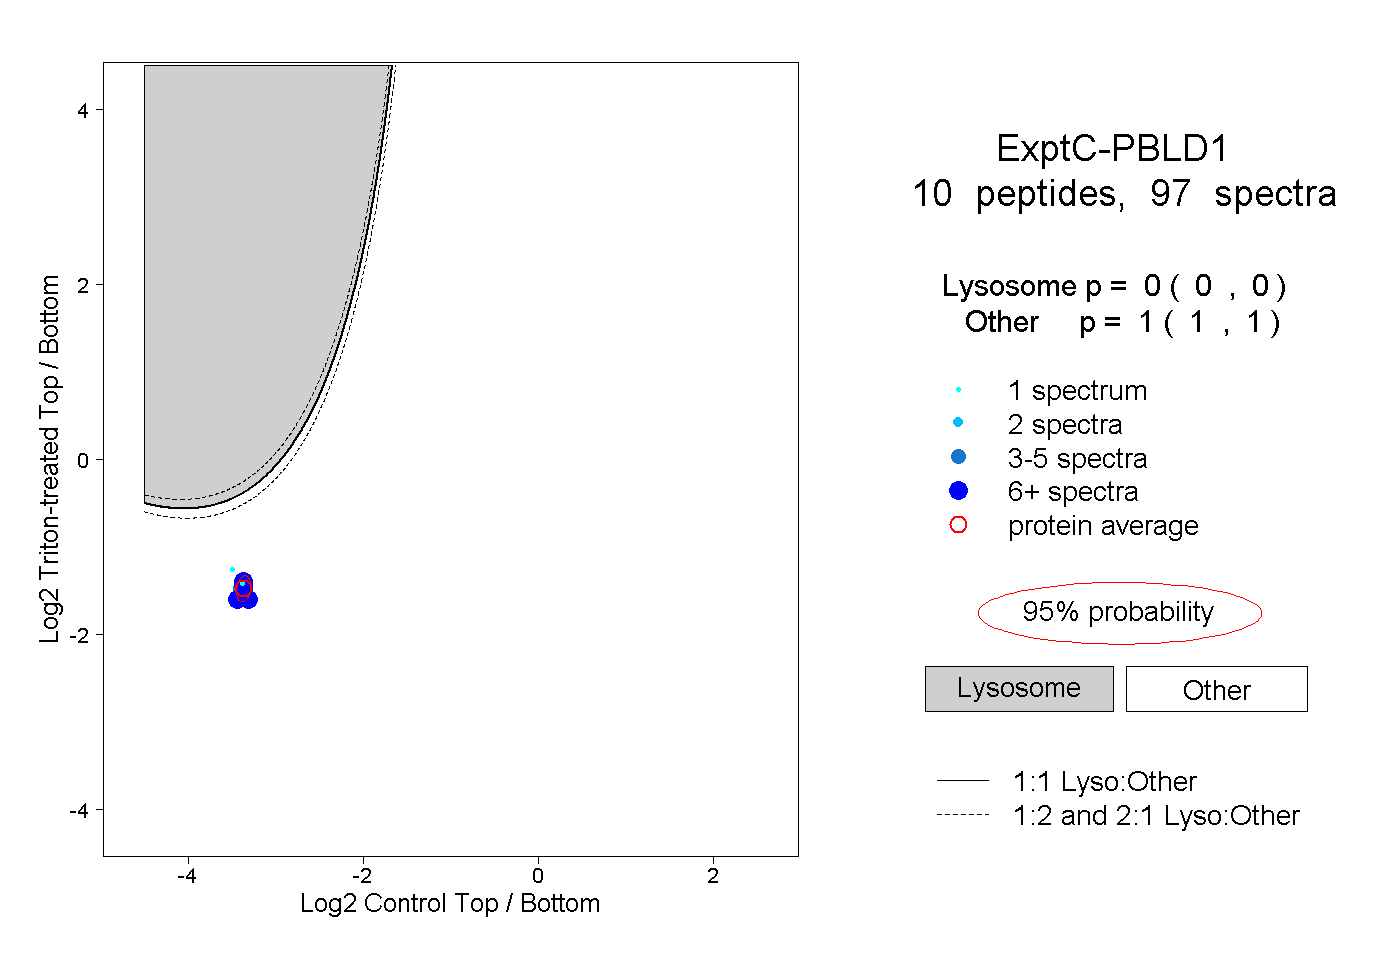 |
0.000 0.000 | 0.000 |
1.000 1.000 | 1.000 |
||||||||
| Plot | Lyso | Other | |||||||||||
| Expt D |
4 peptides |
8 spectra |
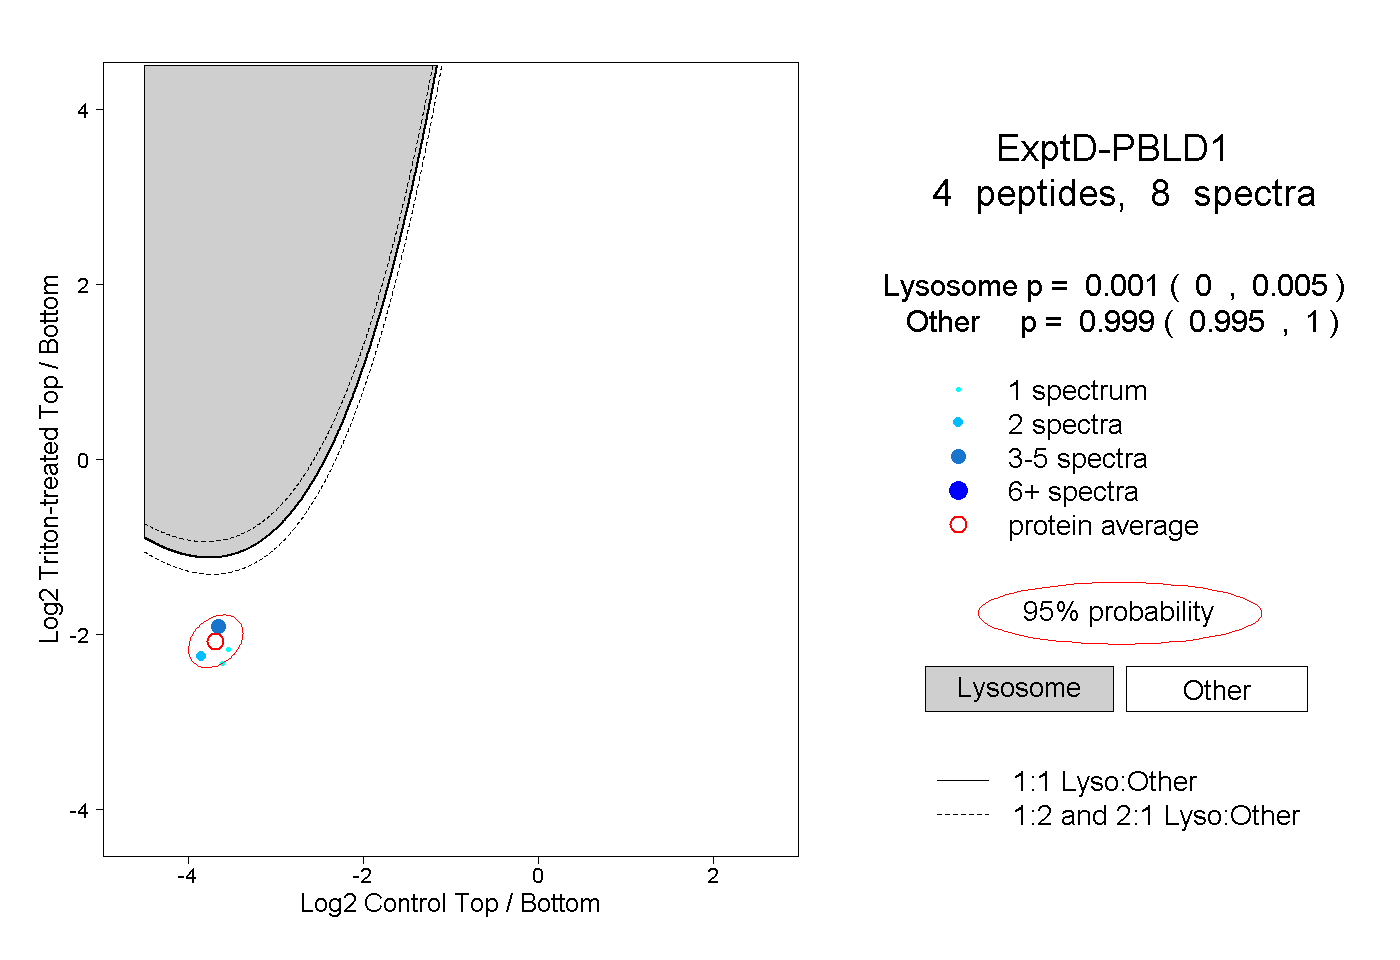 |
0.001 0.000 | 0.005 |
0.999 0.995 | 1.000 |