 7
7peptides
spectra
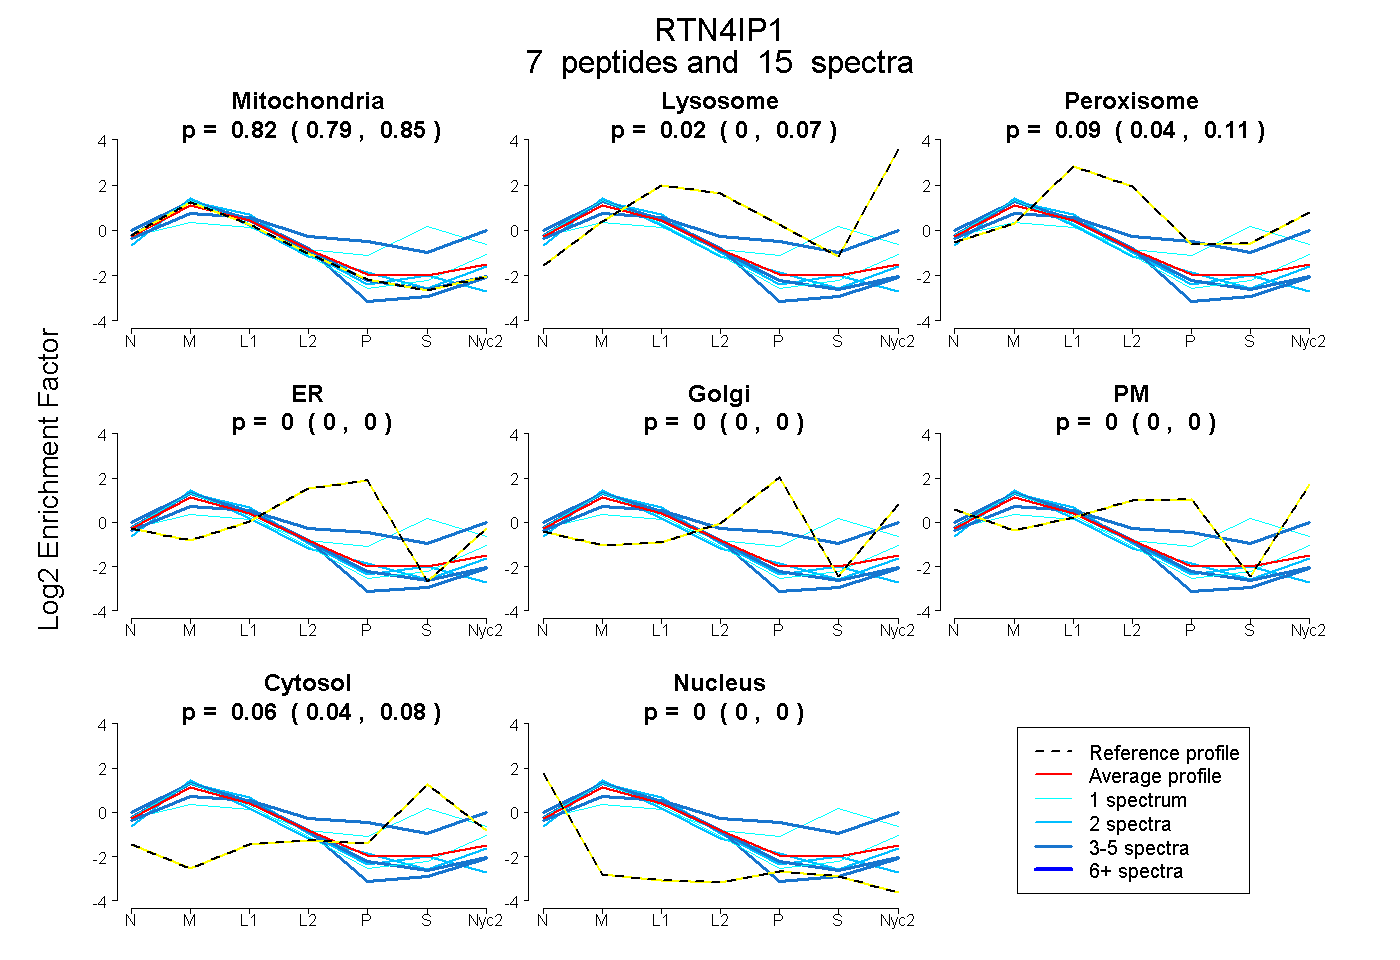
0.795 | 0.851
0.000 | 0.069
0.036 | 0.114
0.000 | 0.000
0.000 | 0.000
0.000 | 0.000
0.042 | 0.082
0.000 | 0.000
3peptides
spectra
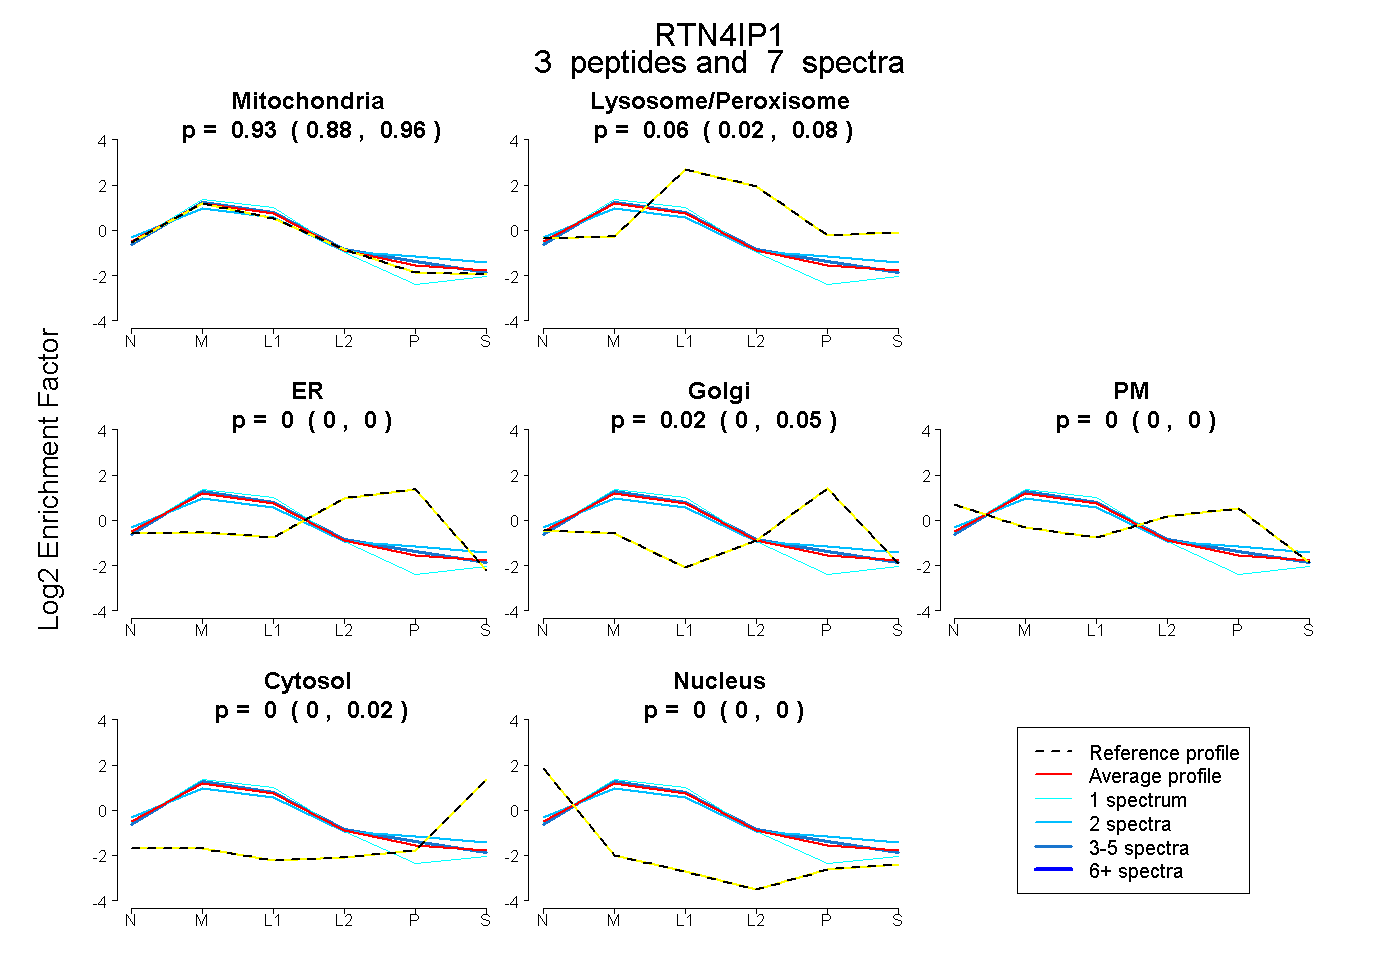
0.878 | 0.961
0.024 | 0.077
0.000 | 0.000
0.000 | 0.046
0.000 | 0.000
0.000 | 0.021
0.000 | 0.000
11peptides
spectra
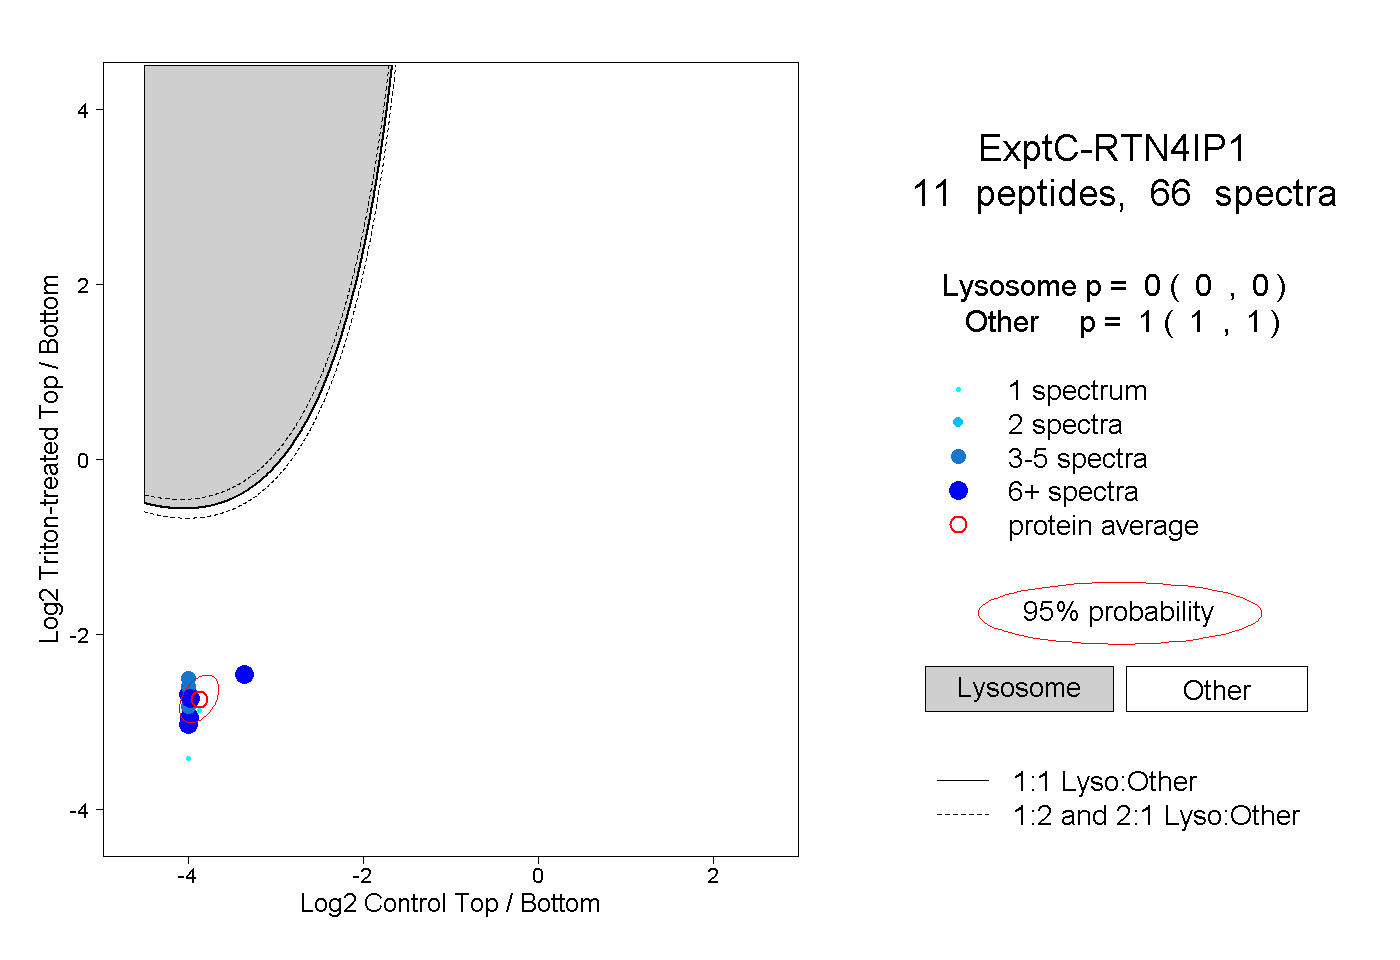
0.000 | 0.000
1.000 | 1.000
4peptides
spectra
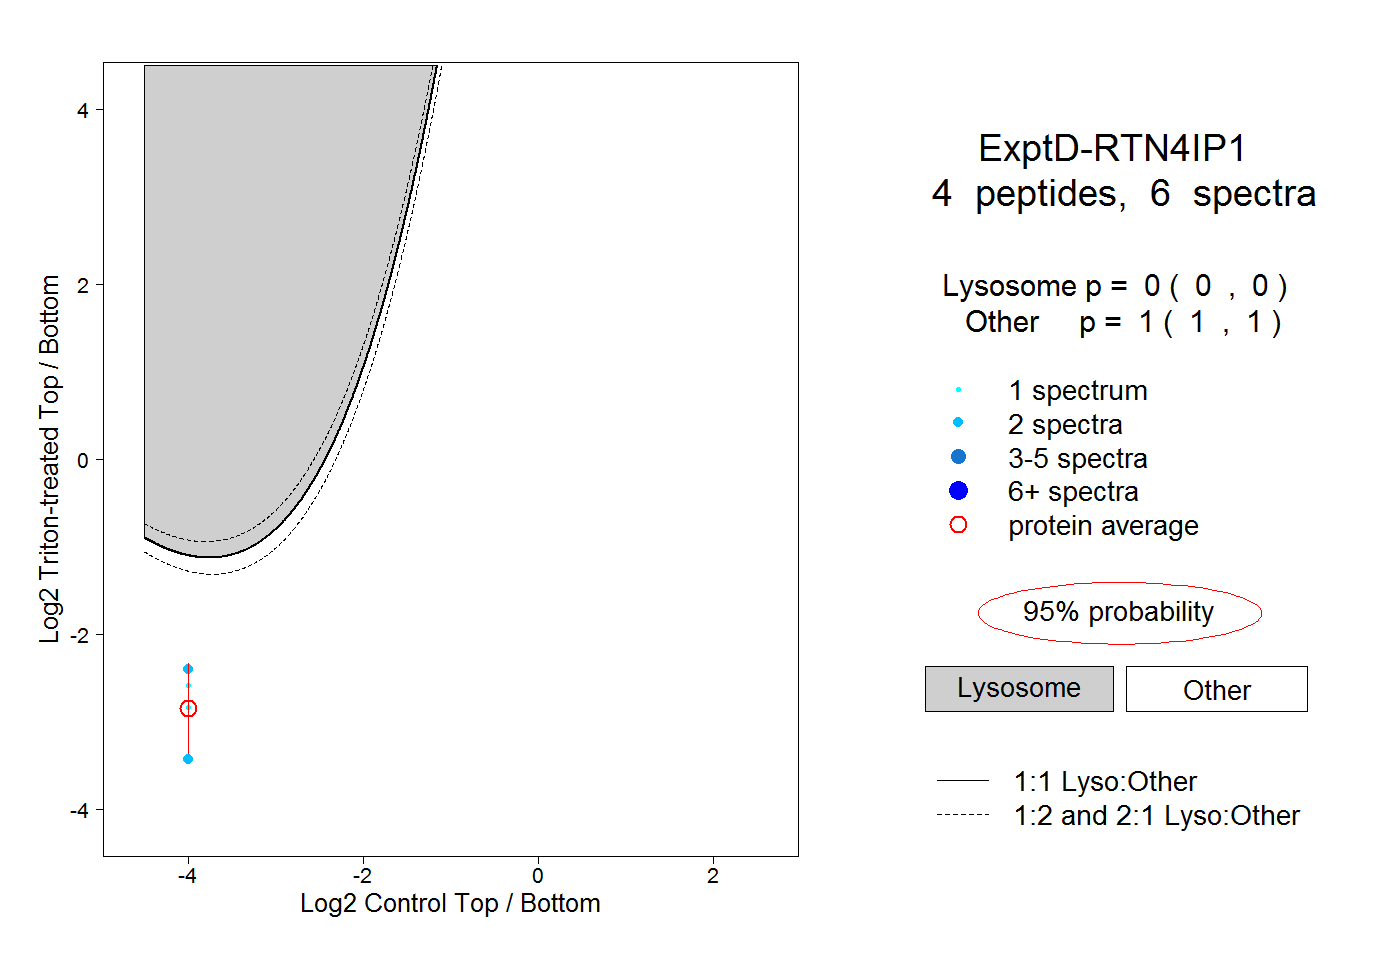
0.000 | 0.000
1.000 | 1.000