 5
5peptides
spectra
0.127 | 0.304
0.000 | 0.000
0.000 | 0.165
0.000 | 0.308
0.043 | 0.377
0.000 | 0.000
0.226 | 0.400
0.000 | 0.002
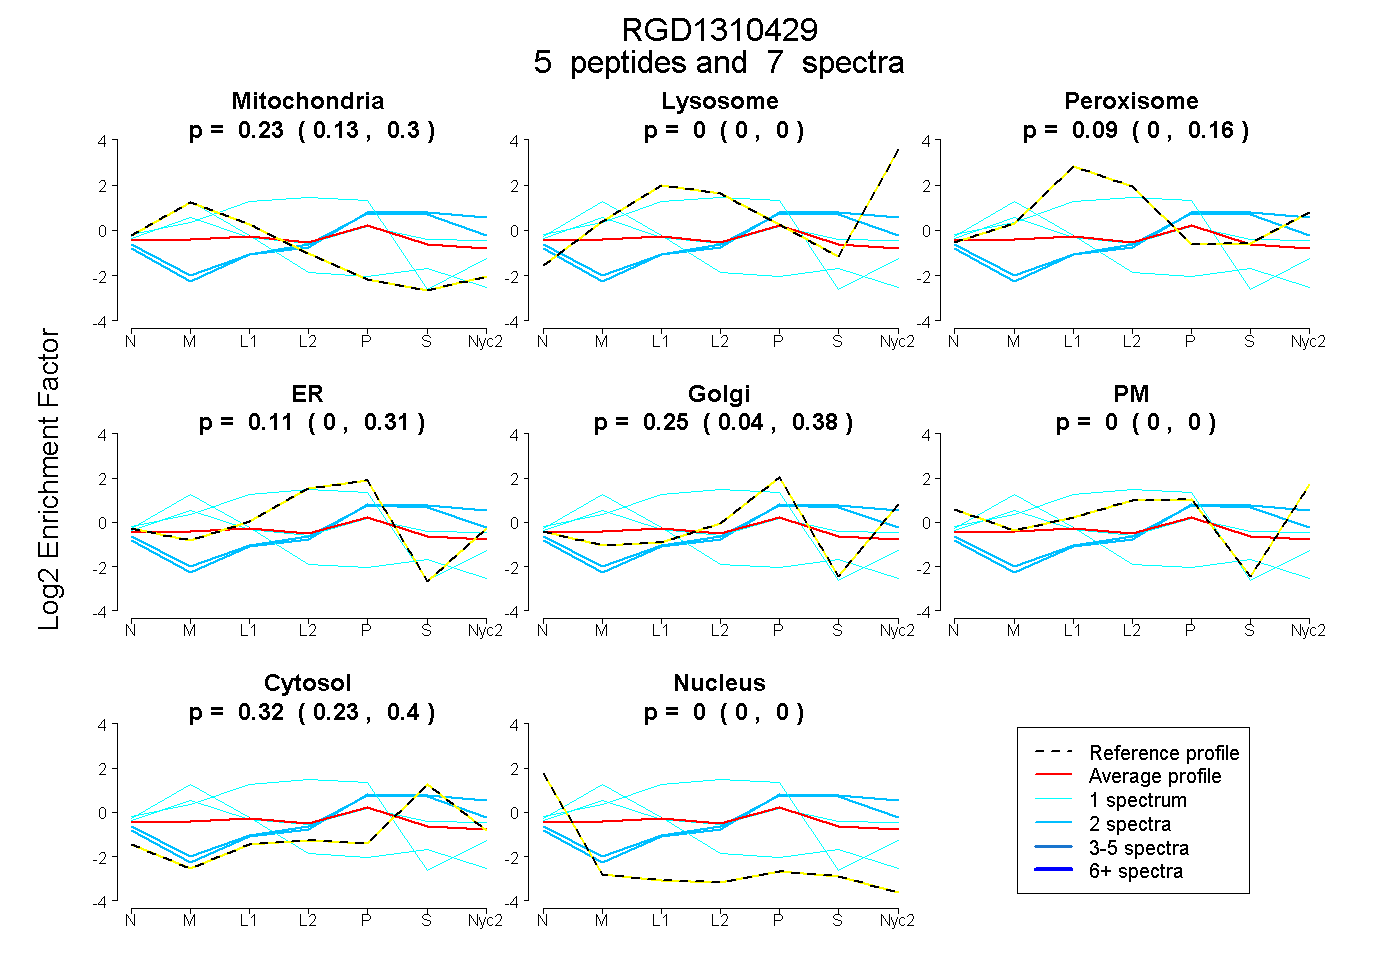
| Plot | Mito | Lyso | Perox | ER | Golgi | PM | Cytosol | Nucleus | |||||
| Expt A |
5 peptides |
7 spectra |
|
0.226 0.127 | 0.304 |
0.000 0.000 | 0.000 |
0.093 0.000 | 0.165 |
0.113 0.000 | 0.308 |
0.247 0.043 | 0.377 |
0.000 0.000 | 0.000 |
0.321 0.226 | 0.400 |
0.000 0.000 | 0.002 |
| 1 spectrum, YIQGLK | 0.174 | 0.000 | 0.155 | 0.671 | 0.000 | 0.000 | 0.000 | 0.000 | ||
| 2 spectra, GAFFEGLGNVASVELR | 0.000 | 0.058 | 0.000 | 0.000 | 0.349 | 0.000 | 0.593 | 0.000 | ||
| 2 spectra, SVVAVLEEFMR | 0.000 | 0.000 | 0.003 | 0.043 | 0.346 | 0.000 | 0.608 | 0.000 | ||
| 1 spectrum, SLGSDLK | 0.284 | 0.000 | 0.171 | 0.000 | 0.310 | 0.000 | 0.236 | 0.000 | ||
| 1 spectrum, NCGSGDILLK | 0.842 | 0.000 | 0.000 | 0.000 | 0.000 | 0.000 | 0.099 | 0.059 |