 2
2peptides
spectra
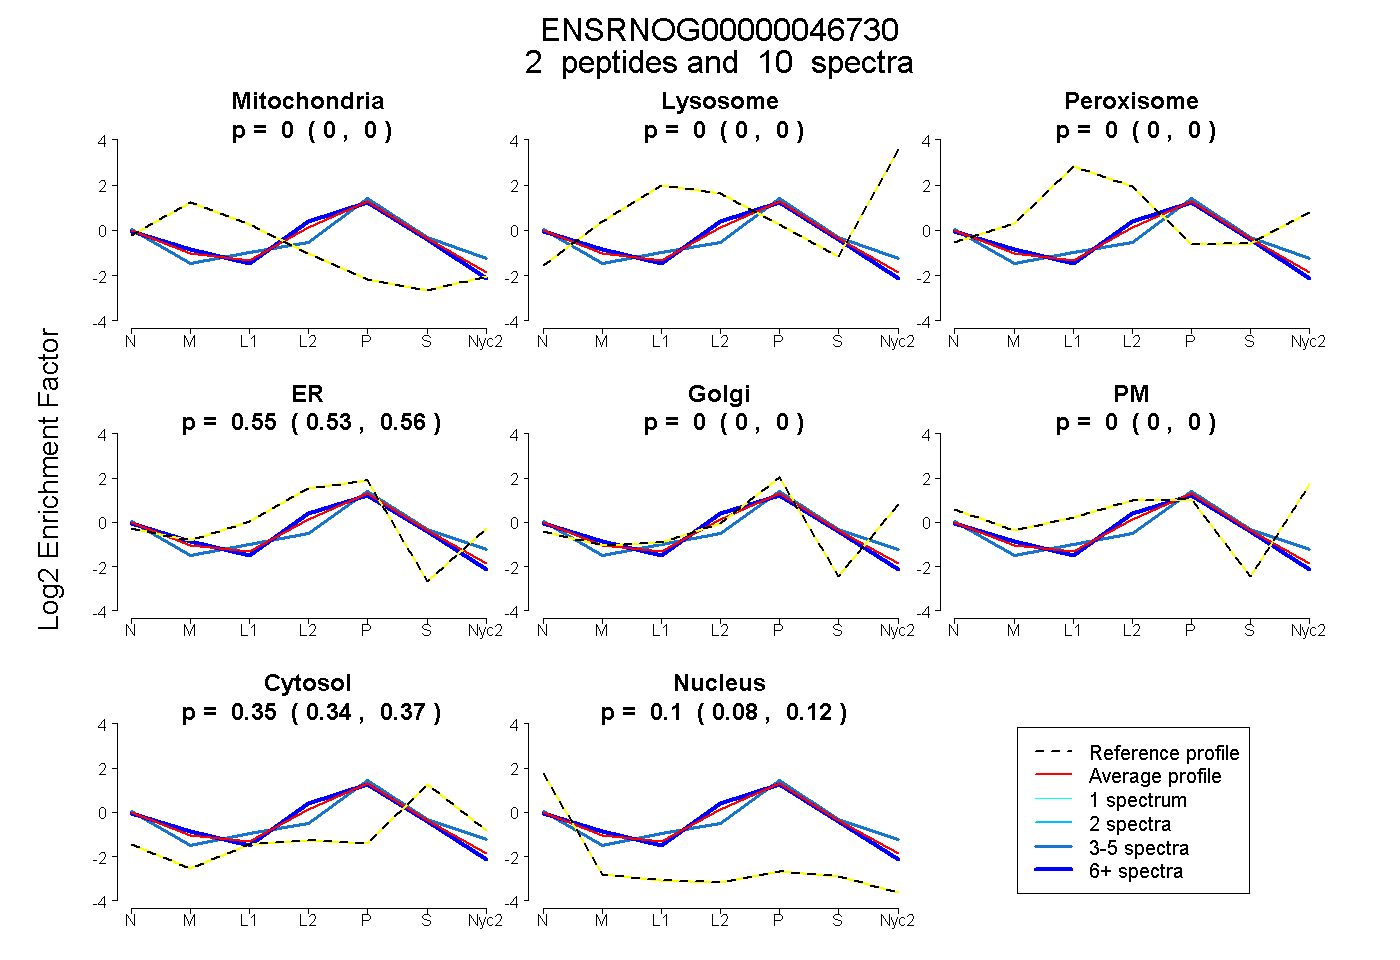
0.000 | 0.000
0.000 | 0.000
0.000 | 0.000
0.530 | 0.558
0.000 | 0.000
0.000 | 0.000
0.336 | 0.368
0.079 | 0.120
3peptides
spectra
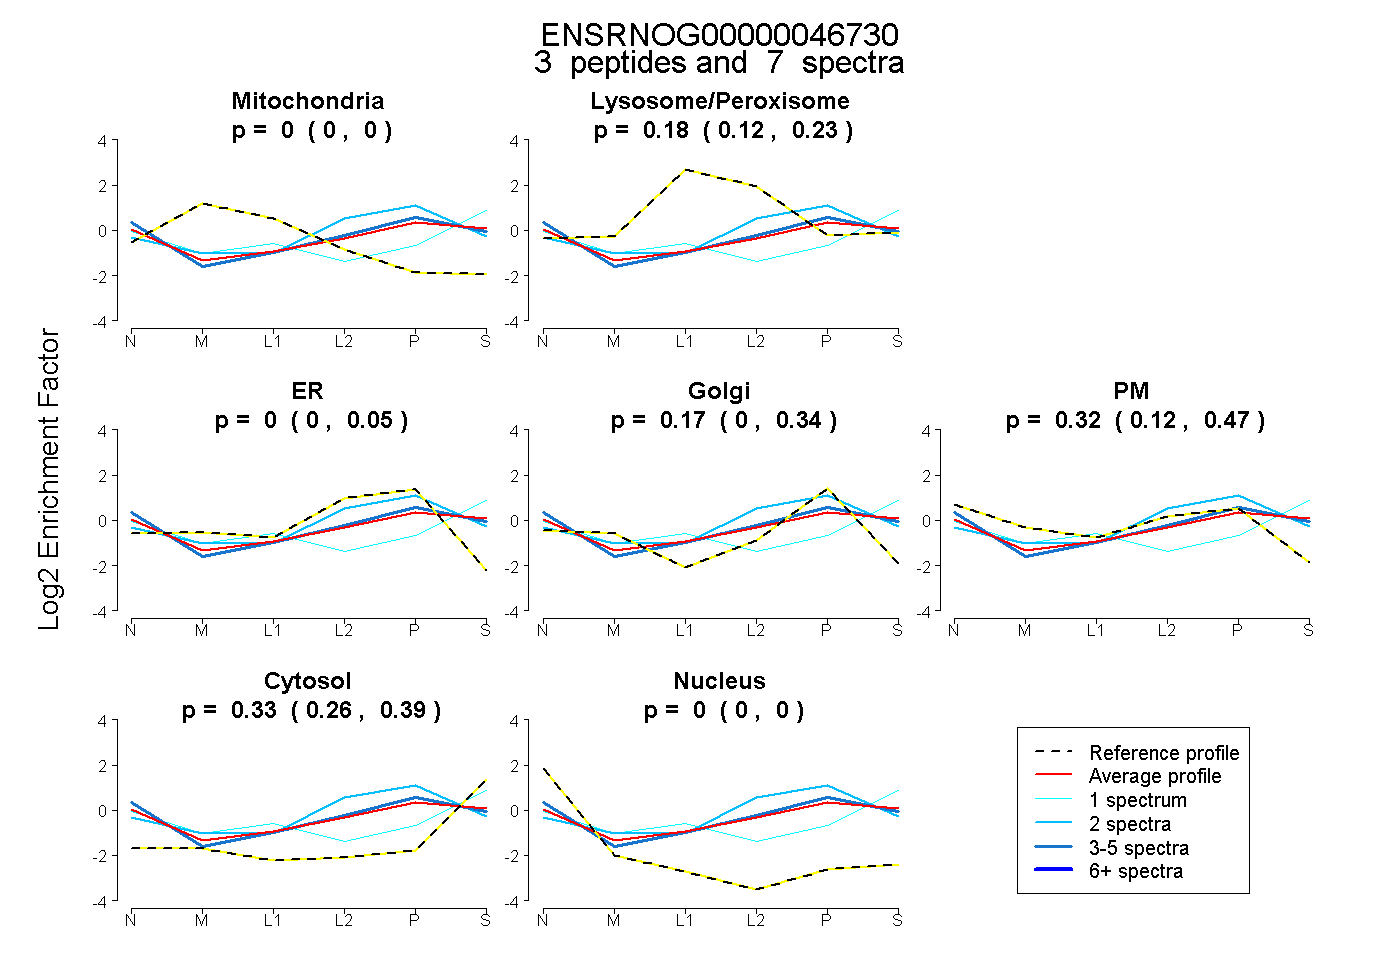
0.000 | 0.000
0.118 | 0.234
0.000 | 0.052
0.000 | 0.342
0.121 | 0.470
0.260 | 0.389
0.000 | 0.000
1peptide
spectrum
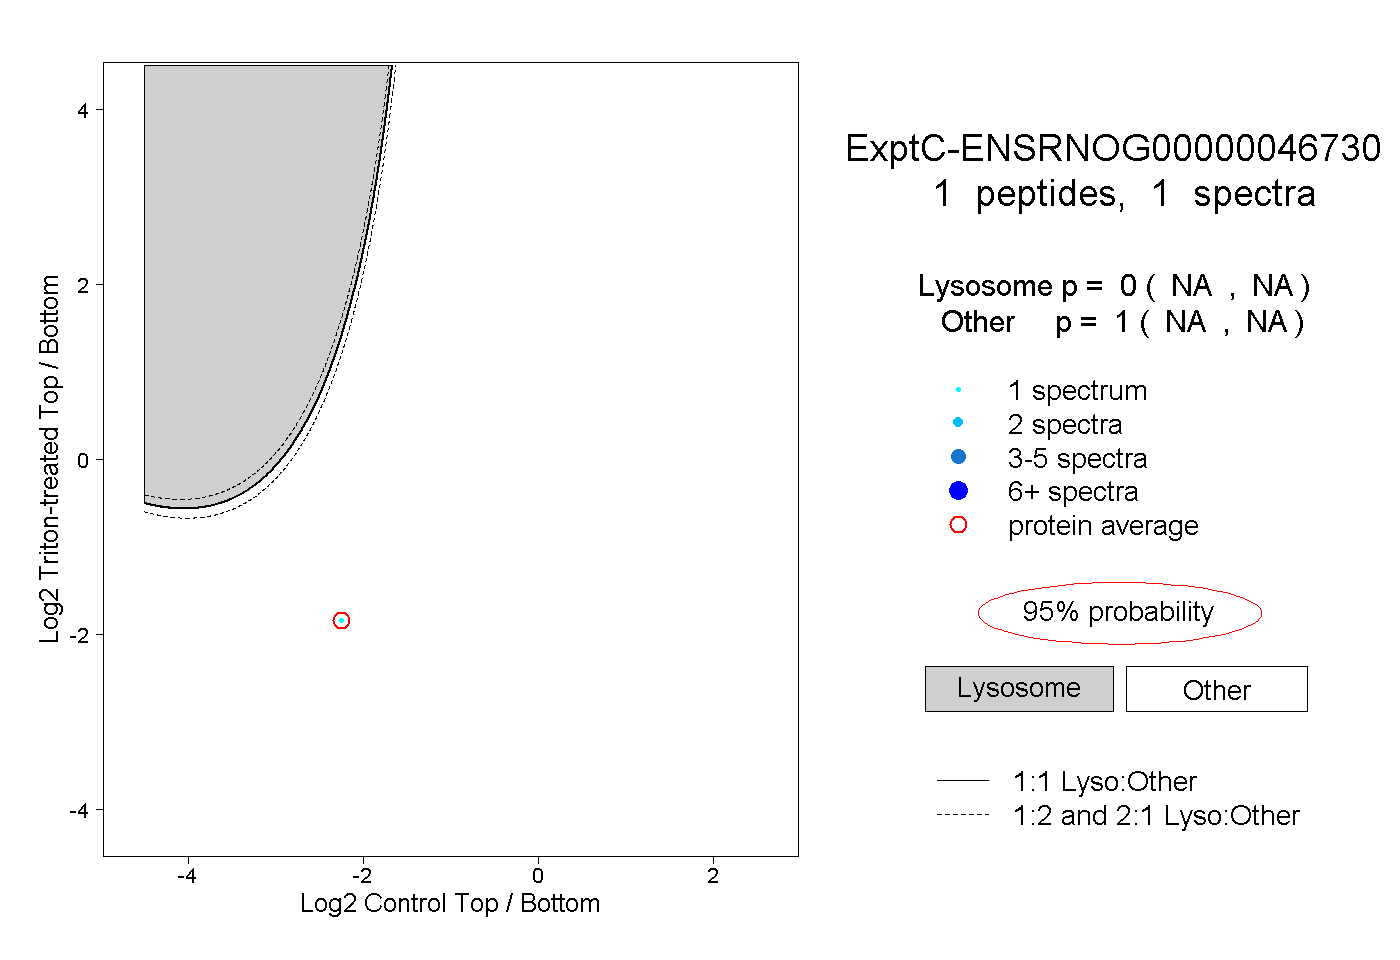
NA | NA
NA | NA
5peptides
spectra
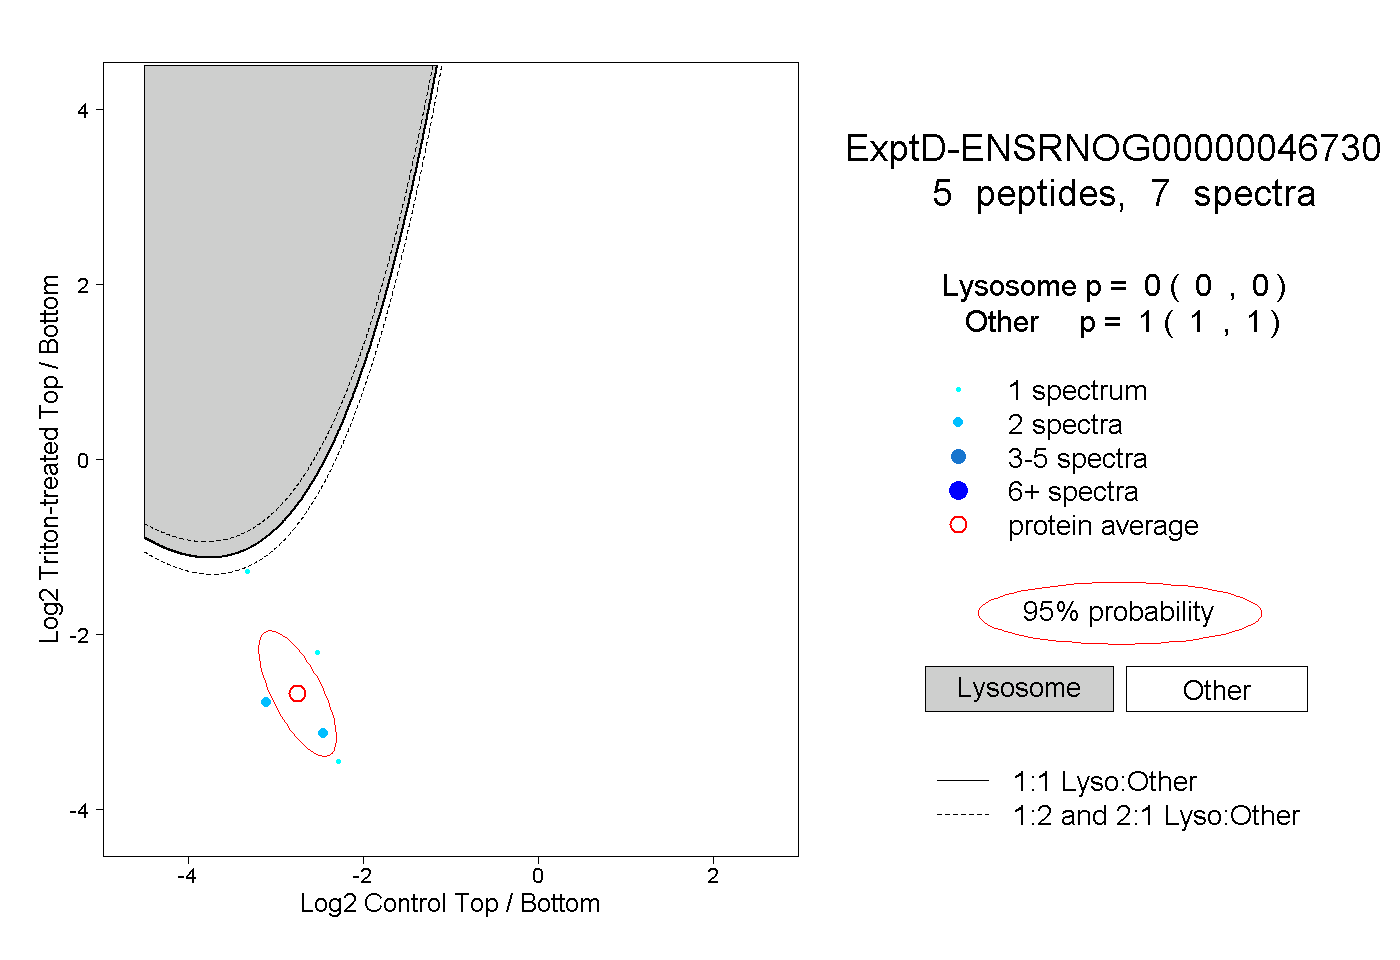
0.000 | 0.000
1.000 | 1.000