12
12peptides
spectra
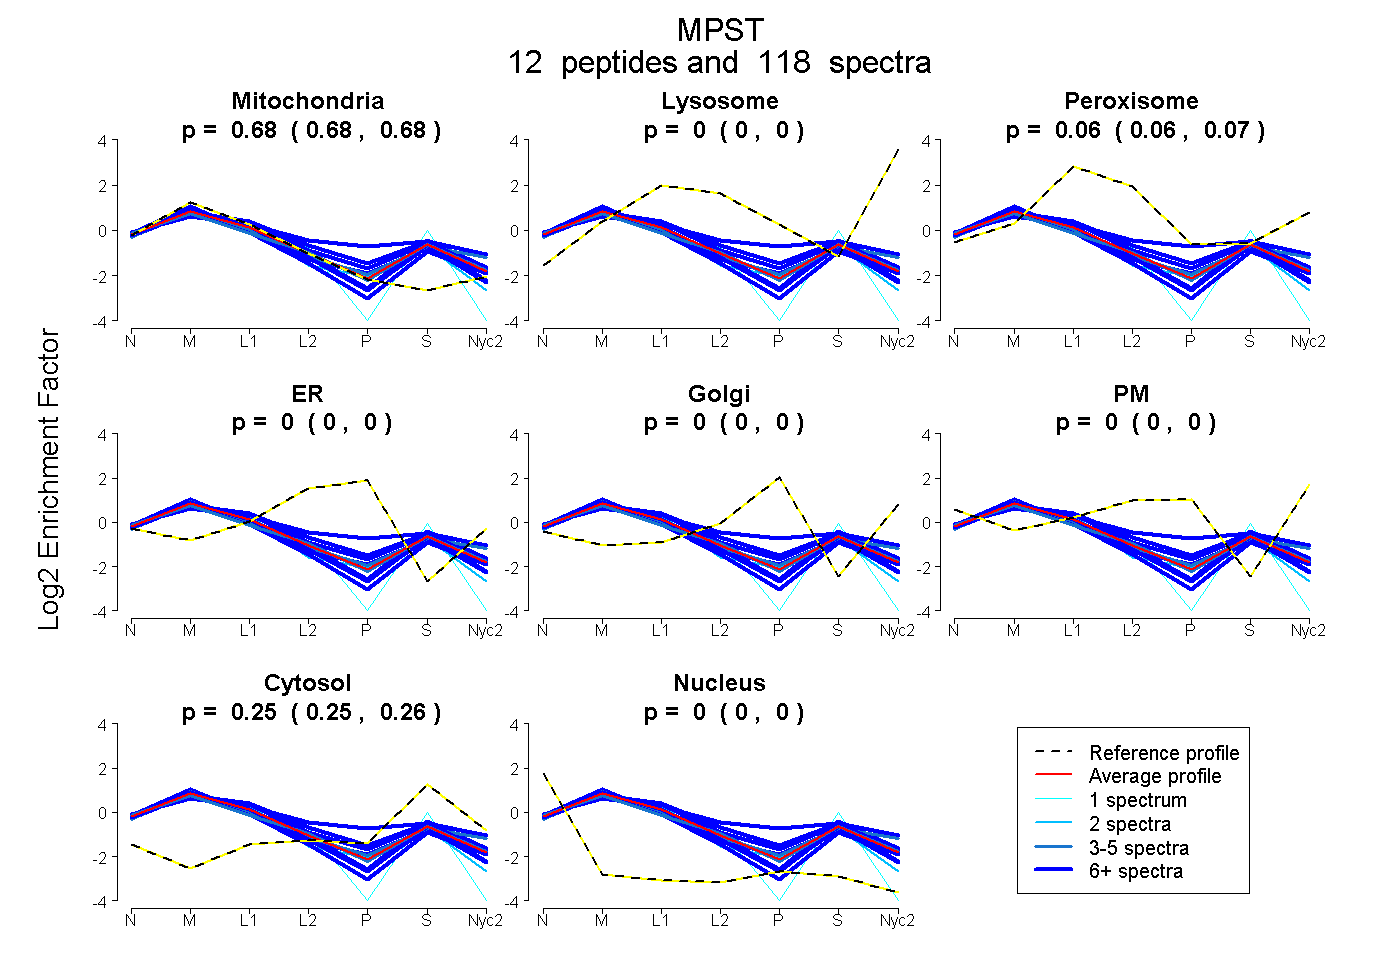
0.677 | 0.685
0.000 | 0.000
0.060 | 0.067
0.000 | 0.000
0.000 | 0.000
0.000 | 0.000
0.253 | 0.256
0.000 | 0.000
10peptides
spectra
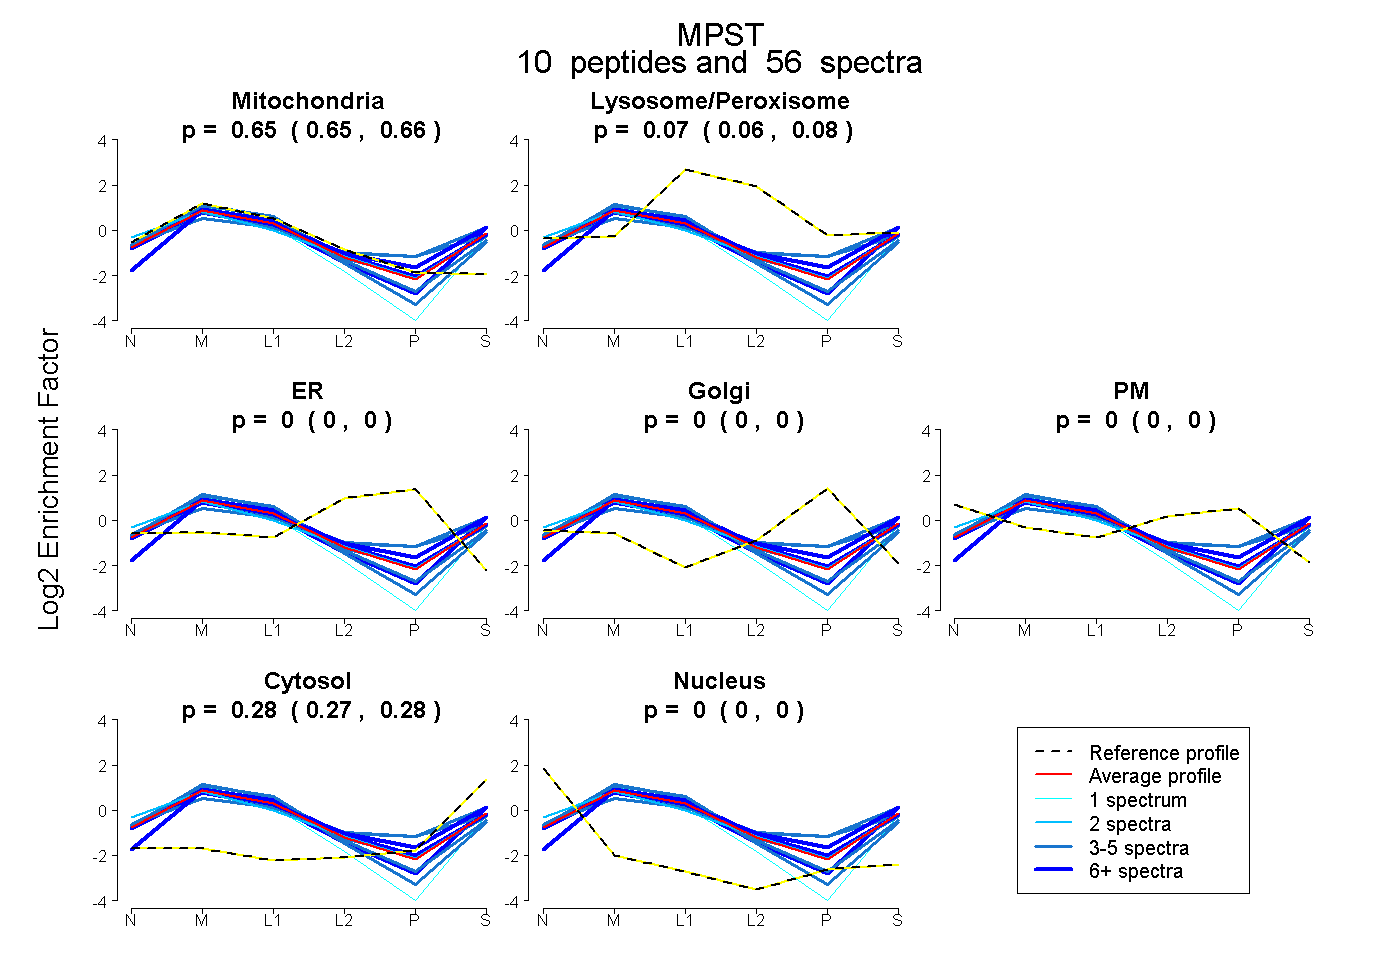
0.647 | 0.660
0.065 | 0.076
0.000 | 0.000
0.000 | 0.000
0.000 | 0.000
0.272 | 0.278
0.000 | 0.000