 12
12peptides
spectra
0.677 | 0.685
0.000 | 0.000
0.060 | 0.067
0.000 | 0.000
0.000 | 0.000
0.000 | 0.000
0.253 | 0.256
0.000 | 0.000
| Plot | Mito | Lyso | Perox | ER | Golgi | PM | Cytosol | Nucleus | |||||
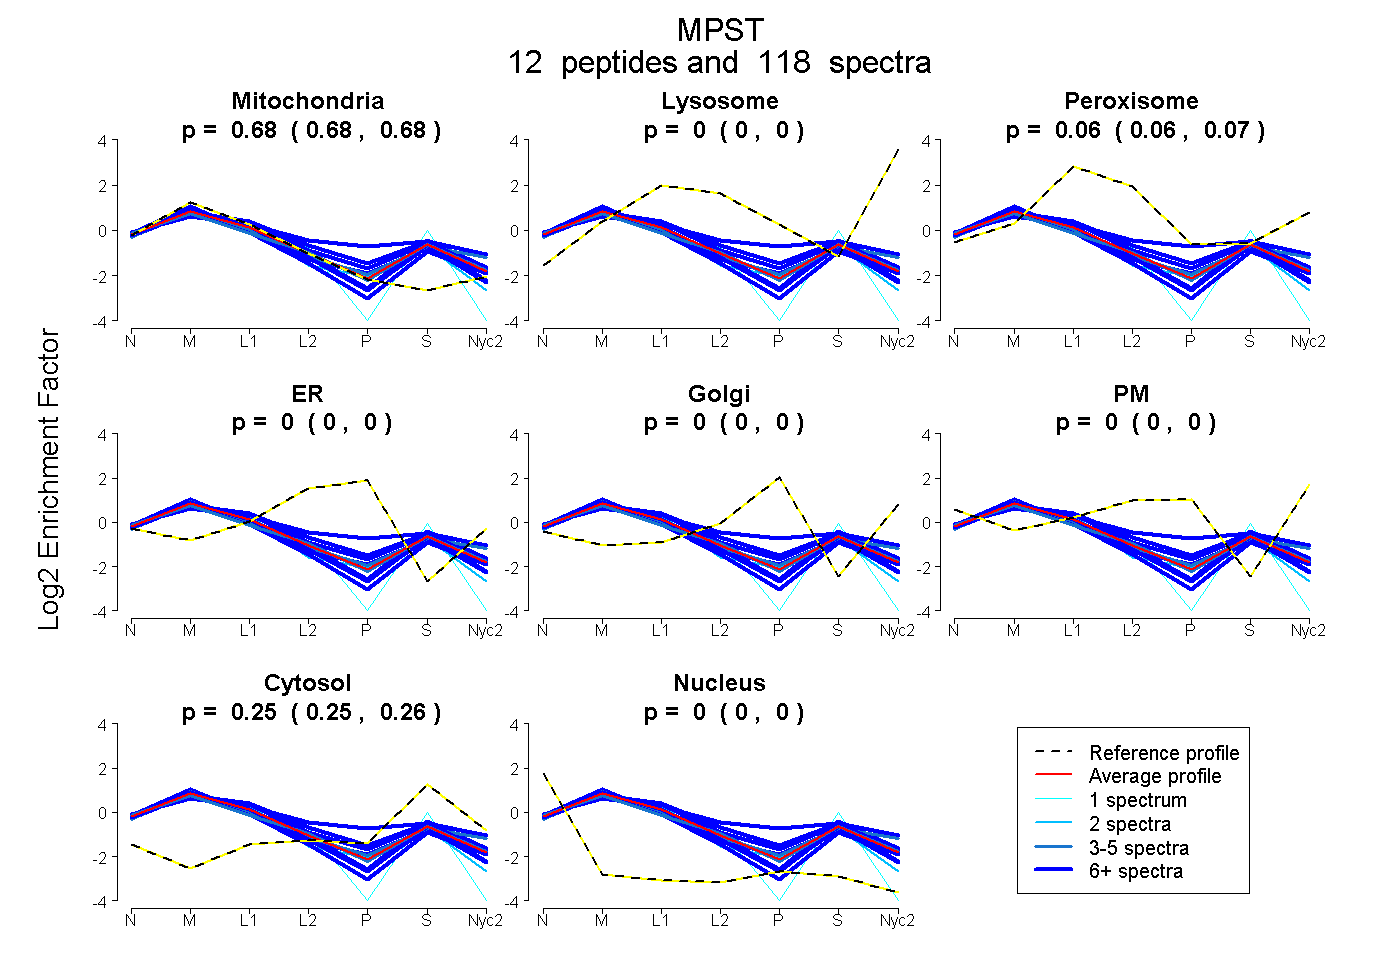
| Expt A |
12 peptides |
118 spectra |
|
0.682 0.677 | 0.685 |
0.000 0.000 | 0.000 |
0.064 0.060 | 0.067 |
0.000 0.000 | 0.000 |
0.000 0.000 | 0.000 |
0.000 0.000 | 0.000 |
0.254 0.253 | 0.256 |
0.000 0.000 | 0.000 |
| 4 spectra, LLDASWYLPK | 0.646 | 0.015 | 0.082 | 0.000 | 0.000 | 0.000 | 0.256 | 0.000 | ||
| 9 spectra, FQGTQPEPR | 0.788 | 0.000 | 0.000 | 0.000 | 0.000 | 0.000 | 0.212 | 0.000 | ||
| 8 spectra, ALVSAQWVAEALK | 0.663 | 0.000 | 0.054 | 0.000 | 0.000 | 0.000 | 0.282 | 0.000 | ||
| 2 spectra, ASQPLK | 0.777 | 0.000 | 0.000 | 0.000 | 0.000 | 0.000 | 0.223 | 0.000 | ||
| 27 spectra, AQPEHVISQGR | 0.438 | 0.000 | 0.242 | 0.000 | 0.087 | 0.000 | 0.232 | 0.000 | ||
| 1 spectrum, AFGHHSVSLLDGGFR | 0.737 | 0.000 | 0.000 | 0.000 | 0.000 | 0.000 | 0.212 | 0.051 | ||
| 10 spectra, FQVVDAR | 0.701 | 0.000 | 0.050 | 0.000 | 0.000 | 0.000 | 0.249 | 0.000 | ||
| 24 spectra, HIPGAAFFDIDR | 0.765 | 0.000 | 0.000 | 0.000 | 0.000 | 0.000 | 0.235 | 0.000 | ||
| 14 spectra, THEDILENLDAR | 0.633 | 0.000 | 0.116 | 0.000 | 0.000 | 0.000 | 0.251 | 0.000 | ||
| 8 spectra, SPEEIQR | 0.759 | 0.000 | 0.000 | 0.000 | 0.000 | 0.000 | 0.241 | 0.000 | ||
| 5 spectra, YWLSQNLPISSGK | 0.681 | 0.000 | 0.041 | 0.000 | 0.000 | 0.000 | 0.279 | 0.000 | ||
| 6 spectra, SPSEPAEFCAQLDPSFIK | 0.587 | 0.000 | 0.170 | 0.000 | 0.000 | 0.000 | 0.242 | 0.000 |
| Plot | Mito | Lyso or Perox | ER | Golgi | PM | Cytosol | Nucleus | ||||||
| Expt B |
10 peptides |
56 spectra |
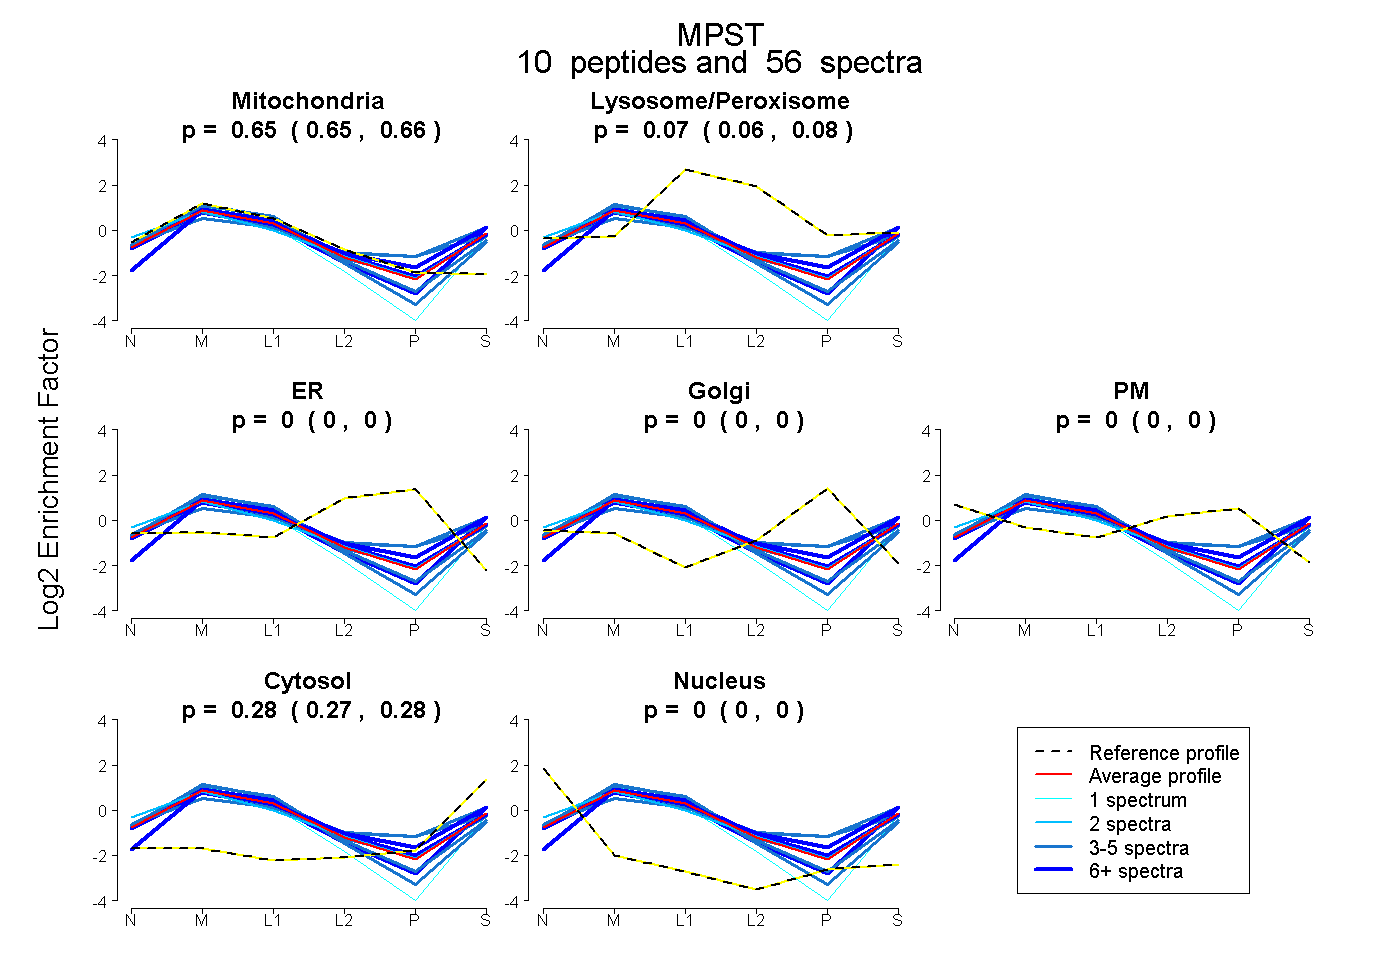 |
0.654 0.647 | 0.660 |
0.071 0.065 | 0.076 |
0.000 0.000 | 0.000 |
0.000 0.000 | 0.000 |
0.000 0.000 | 0.000 |
0.275 0.272 | 0.278 |
0.000 0.000 | 0.000 |
|||
| Plot | Lyso | Other | |||||||||||
| Expt C |
11 peptides |
296 spectra |
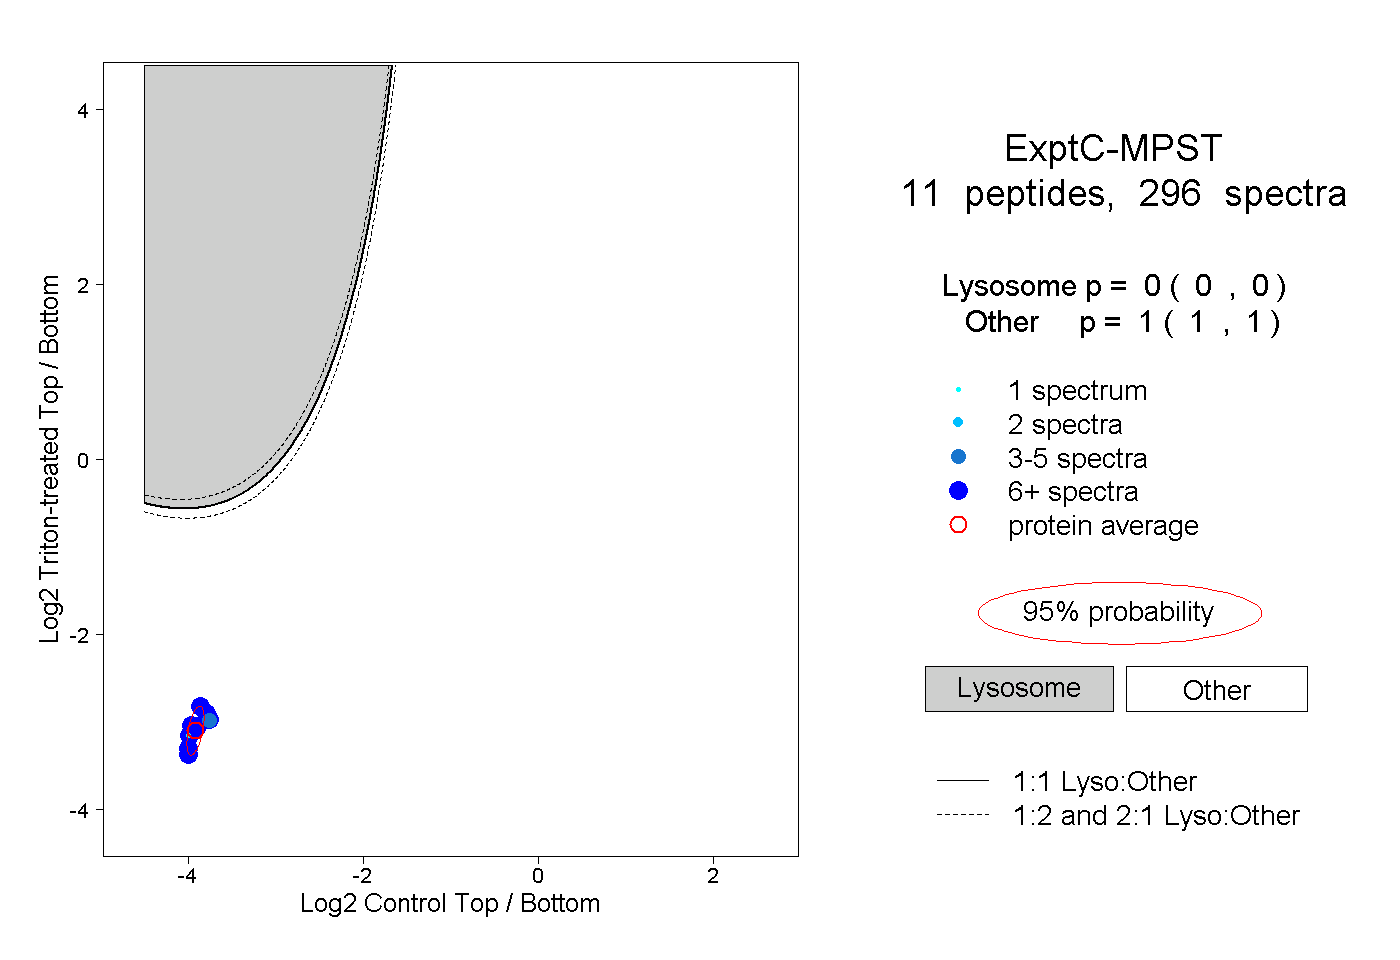 |
0.000 0.000 | 0.000 |
1.000 1.000 | 1.000 |
||||||||
| Plot | Lyso | Other | |||||||||||
| Expt D |
5 peptides |
19 spectra |
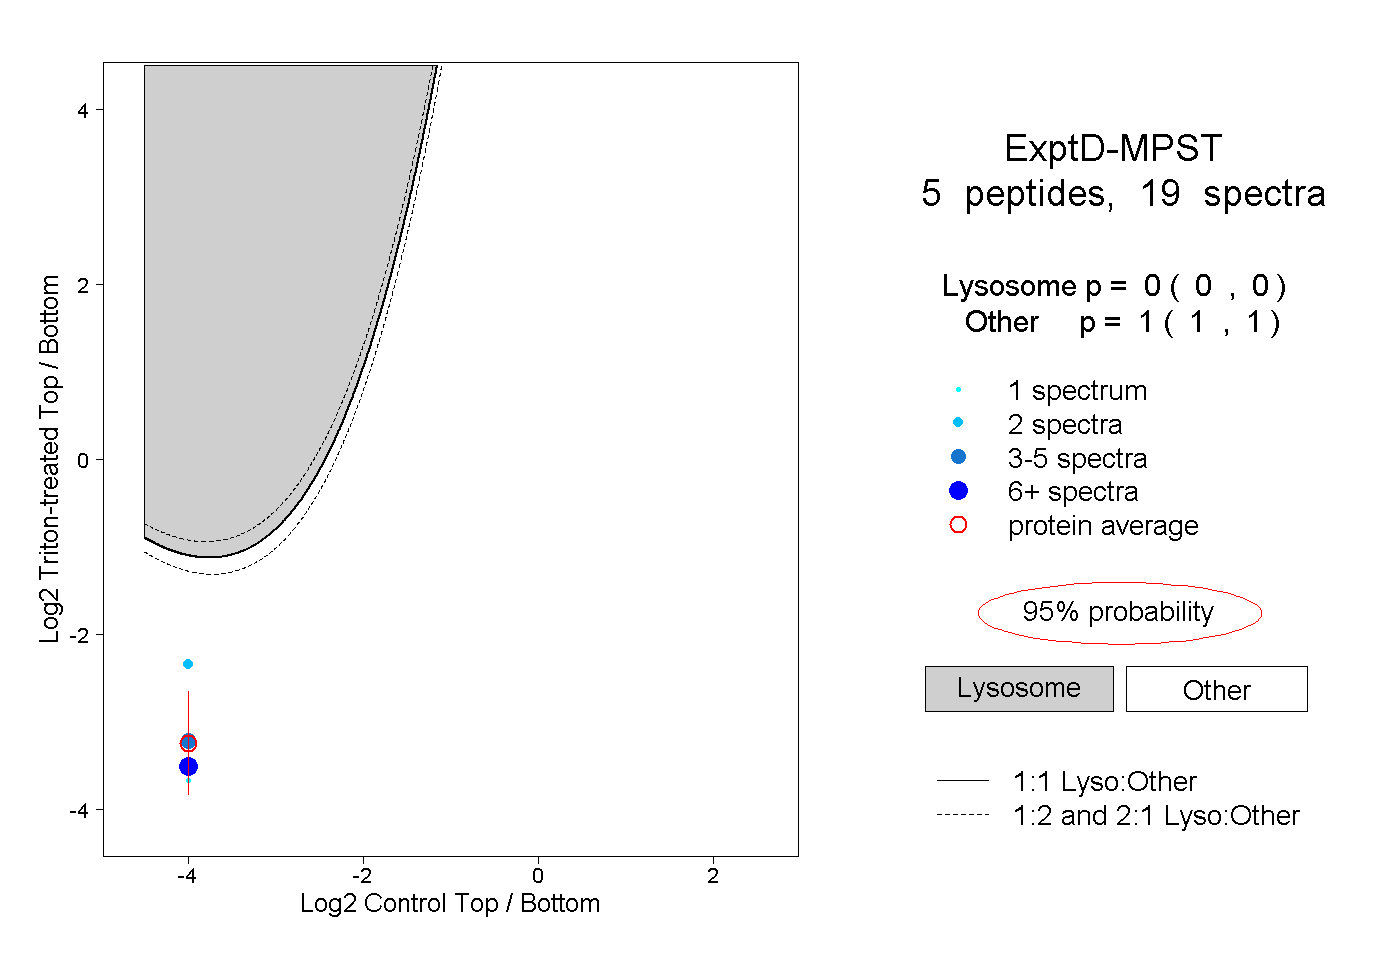 |
0.000 0.000 | 0.000 |
1.000 1.000 | 1.000 |