15
15peptides
spectra
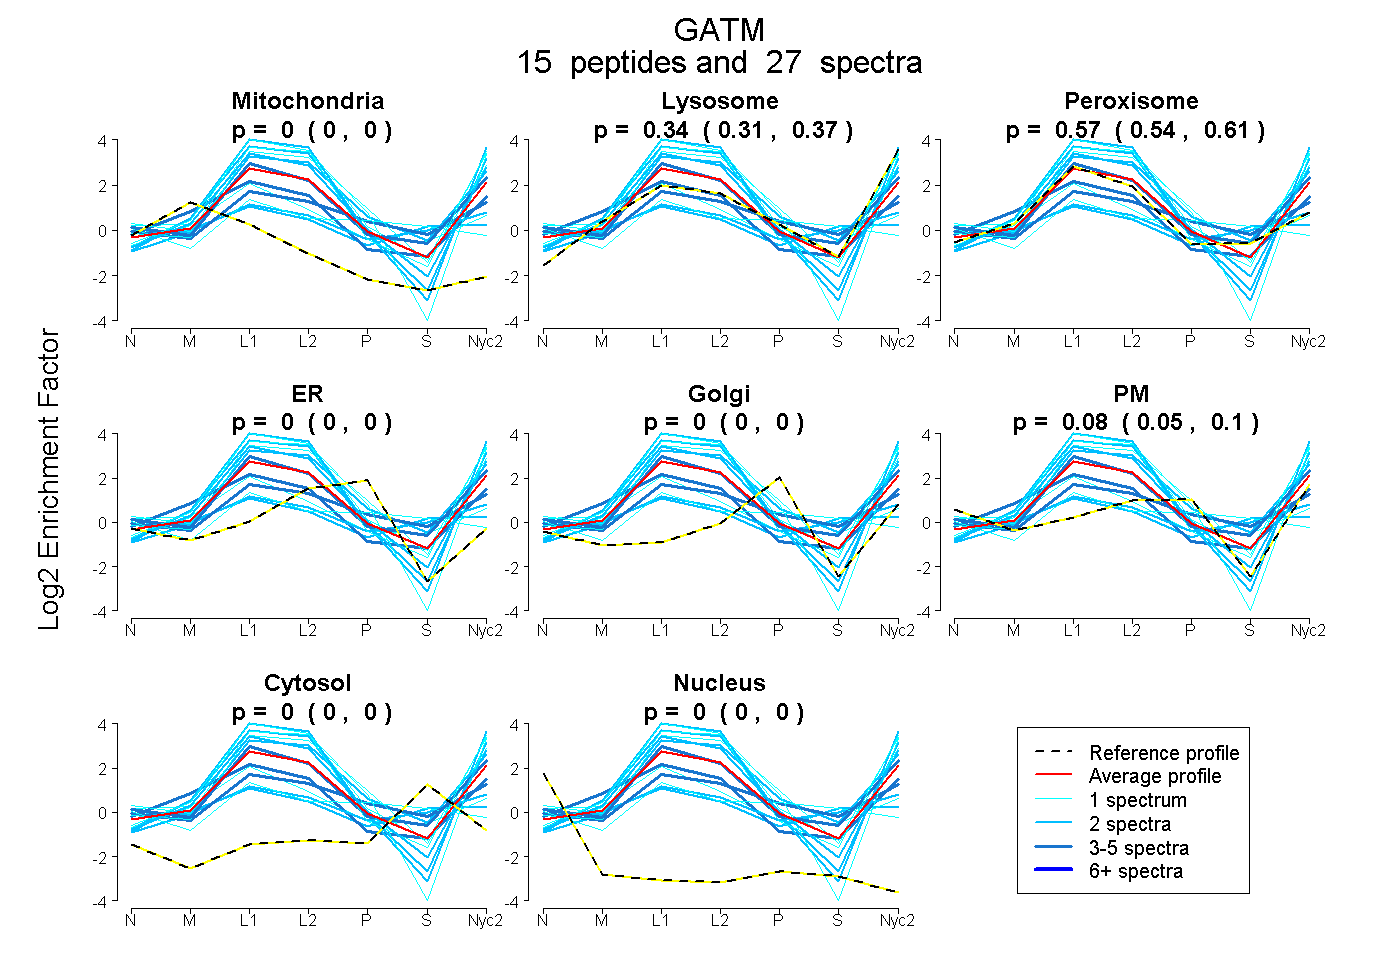
0.000 | 0.000
0.308 | 0.375
0.537 | 0.605
0.000 | 0.000
0.000 | 0.000
0.054 | 0.102
0.000 | 0.000
0.000 | 0.000
4peptides
spectra
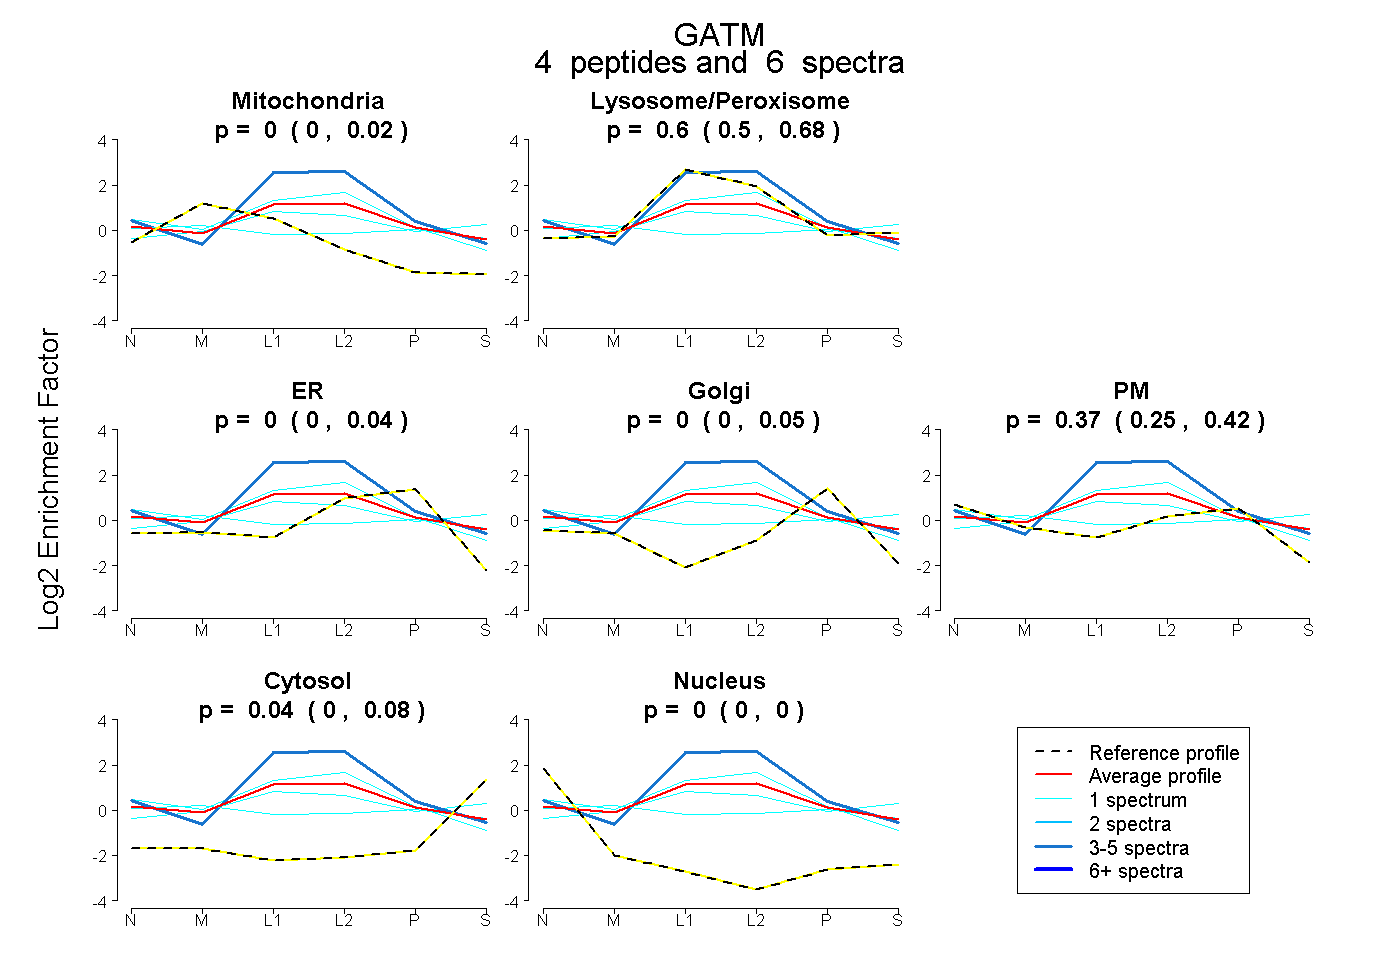
0.000 | 0.016
0.497 | 0.682
0.000 | 0.036
0.000 | 0.048
0.249 | 0.424
0.000 | 0.078
0.000 | 0.000
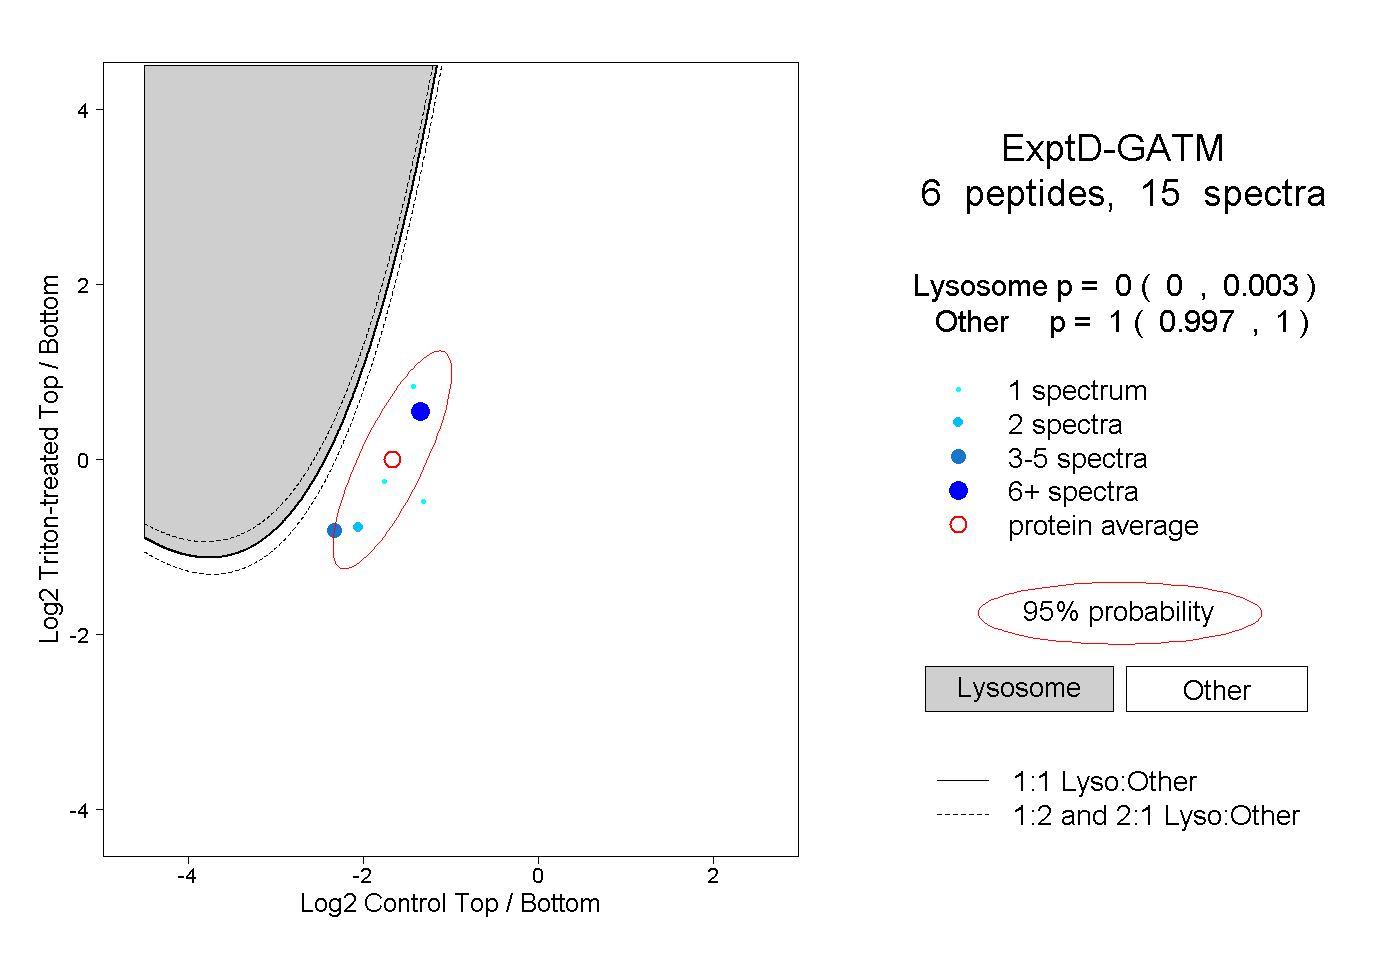
18peptides
spectra
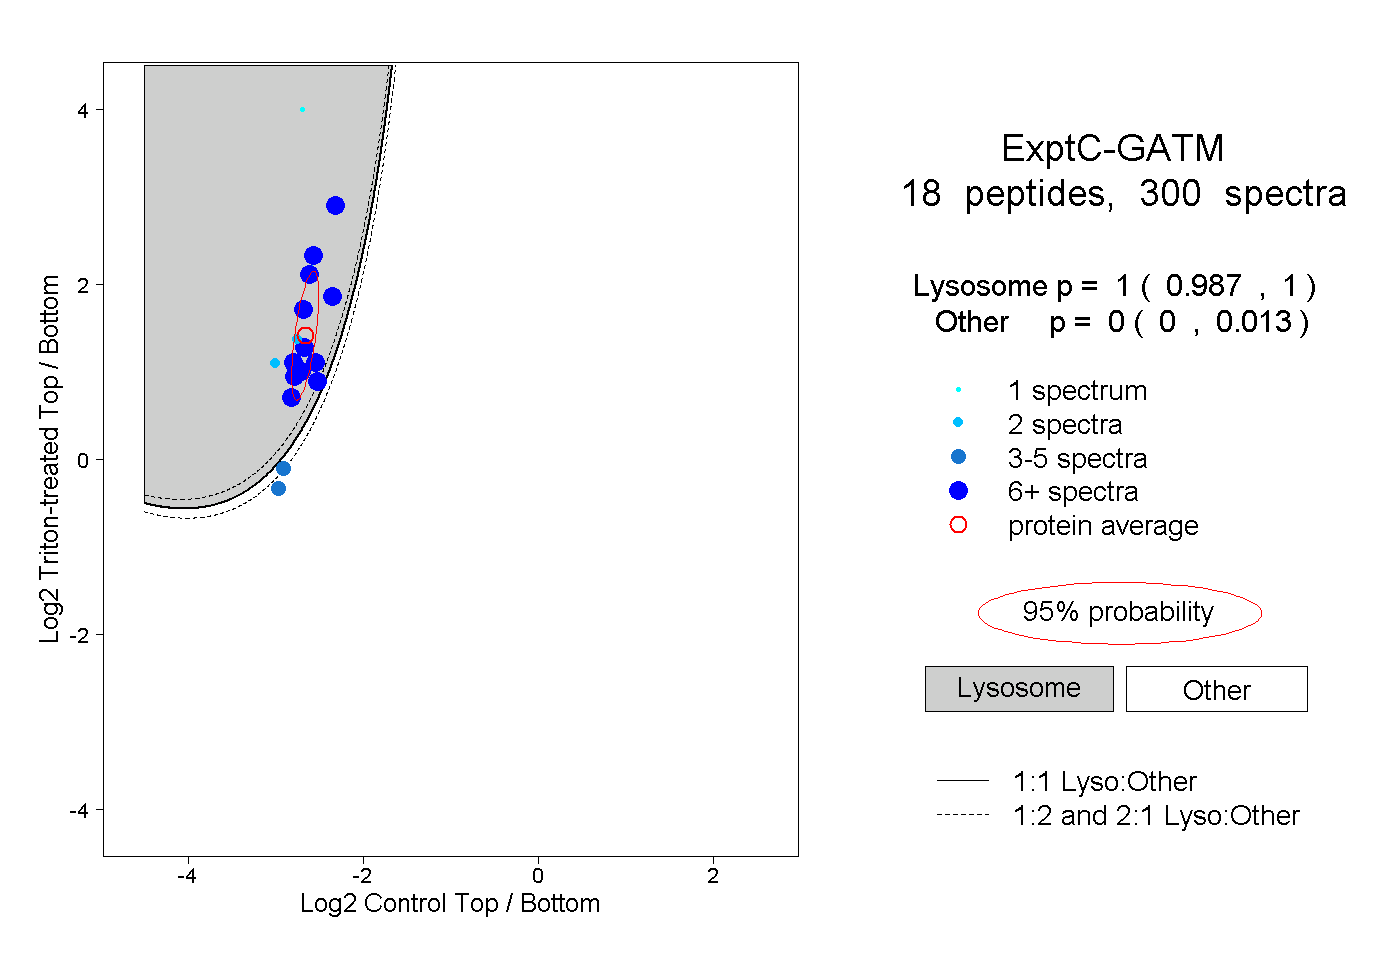
0.987 | 1.000
0.000 | 0.013