 15
15peptides
spectra
0.000 | 0.000
0.308 | 0.375
0.537 | 0.605
0.000 | 0.000
0.000 | 0.000
0.054 | 0.102
0.000 | 0.000
0.000 | 0.000
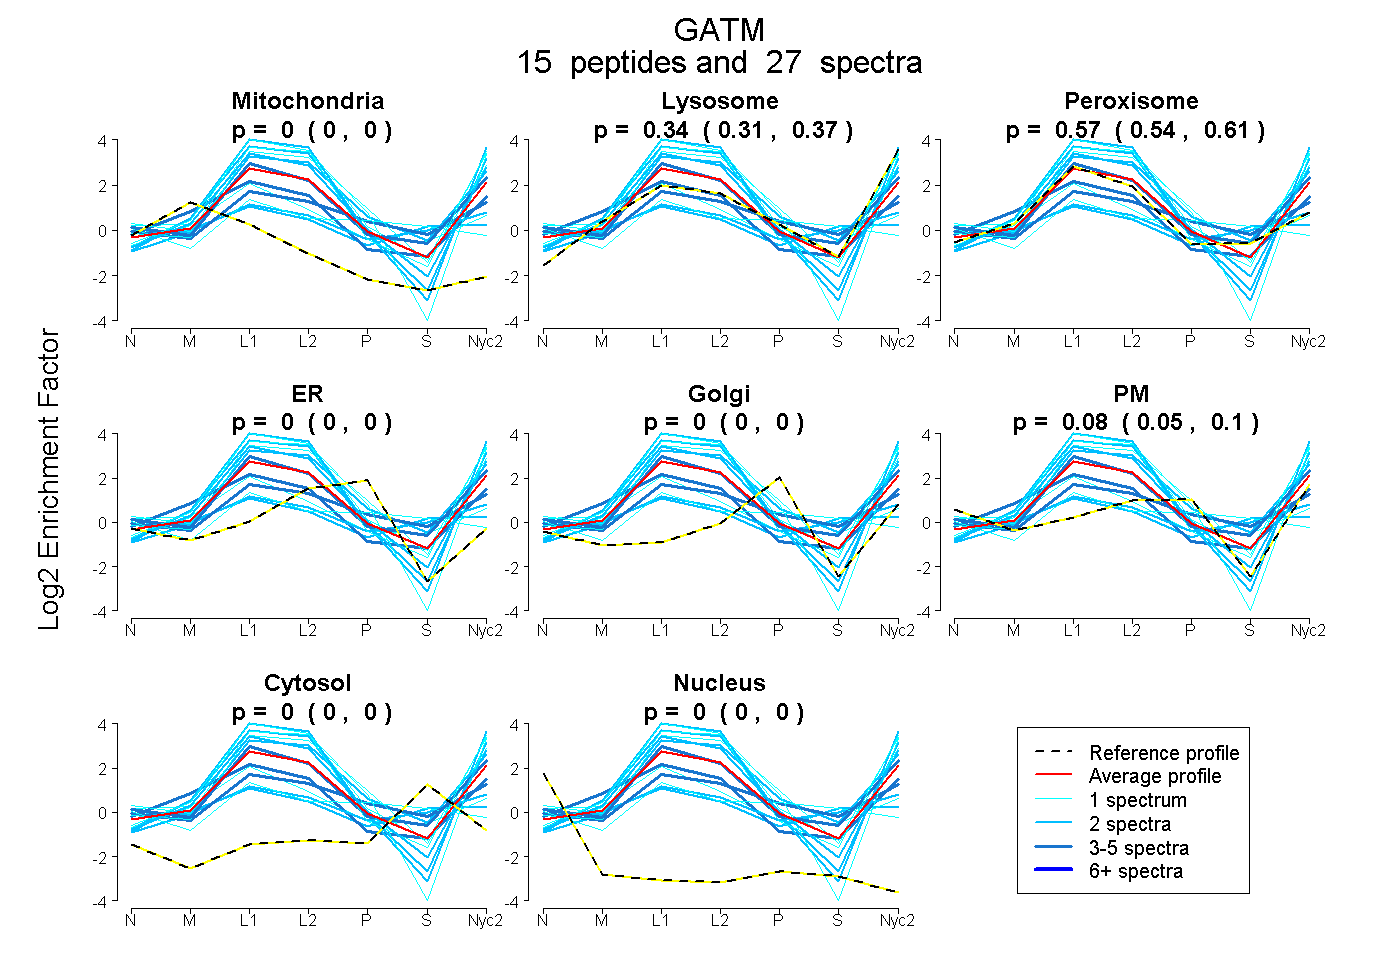
| Plot | Mito | Lyso | Perox | ER | Golgi | PM | Cytosol | Nucleus | |||||
| Expt A |
15 peptides |
27 spectra |
|
0.000 0.000 | 0.000 |
0.345 0.308 | 0.375 |
0.574 0.537 | 0.605 |
0.000 0.000 | 0.000 |
0.000 0.000 | 0.000 |
0.081 0.054 | 0.102 |
0.000 0.000 | 0.000 |
0.000 0.000 | 0.000 |
| 2 spectra, AENACVPPFTVEVK | 0.080 | 0.000 | 0.549 | 0.000 | 0.000 | 0.087 | 0.284 | 0.000 | ||
| 3 spectra, DIFAQR | 0.130 | 0.260 | 0.567 | 0.000 | 0.000 | 0.043 | 0.000 | 0.000 | ||
| 3 spectra, TPDFESTGLYSAMPR | 0.000 | 0.329 | 0.642 | 0.000 | 0.000 | 0.029 | 0.000 | 0.000 | ||
| 2 spectra, SQVTNYLGIEWMR | 0.000 | 0.813 | 0.187 | 0.000 | 0.000 | 0.000 | 0.000 | 0.000 | ||
| 1 spectrum, NANSLGGGFHCWTCDVR | 0.000 | 0.000 | 0.487 | 0.200 | 0.020 | 0.000 | 0.293 | 0.000 | ||
| 2 spectra, GTLQSYFD | 0.003 | 0.030 | 0.530 | 0.000 | 0.000 | 0.187 | 0.251 | 0.000 | ||
| 1 spectrum, VMVDANEVPIQK | 0.000 | 0.638 | 0.362 | 0.000 | 0.000 | 0.000 | 0.000 | 0.000 | ||
| 2 spectra, YWPFYQK | 0.000 | 0.594 | 0.406 | 0.000 | 0.000 | 0.000 | 0.000 | 0.000 | ||
| 1 spectrum, NGGLYFPK | 0.000 | 0.585 | 0.392 | 0.024 | 0.000 | 0.000 | 0.000 | 0.000 | ||
| 3 spectra, HLAPDYR | 0.000 | 0.090 | 0.539 | 0.000 | 0.000 | 0.253 | 0.118 | 0.000 | ||
| 2 spectra, LGISTIK | 0.000 | 0.683 | 0.317 | 0.000 | 0.000 | 0.000 | 0.000 | 0.000 | ||
| 1 spectrum, AVAEVEEMCNILSMEGVTVK | 0.032 | 0.000 | 0.754 | 0.000 | 0.000 | 0.125 | 0.045 | 0.044 | ||
| 1 spectrum, WLSMNVLMLDEK | 0.000 | 0.599 | 0.114 | 0.000 | 0.000 | 0.287 | 0.000 | 0.000 | ||
| 1 spectrum, RPDPIDWSLK | 0.000 | 0.650 | 0.350 | 0.000 | 0.000 | 0.000 | 0.000 | 0.000 | ||
| 2 spectra, ANTYEK | 0.000 | 0.541 | 0.459 | 0.000 | 0.000 | 0.000 | 0.000 | 0.000 |
| Plot | Mito | Lyso or Perox | ER | Golgi | PM | Cytosol | Nucleus | ||||||
| Expt B |
4 peptides |
6 spectra |
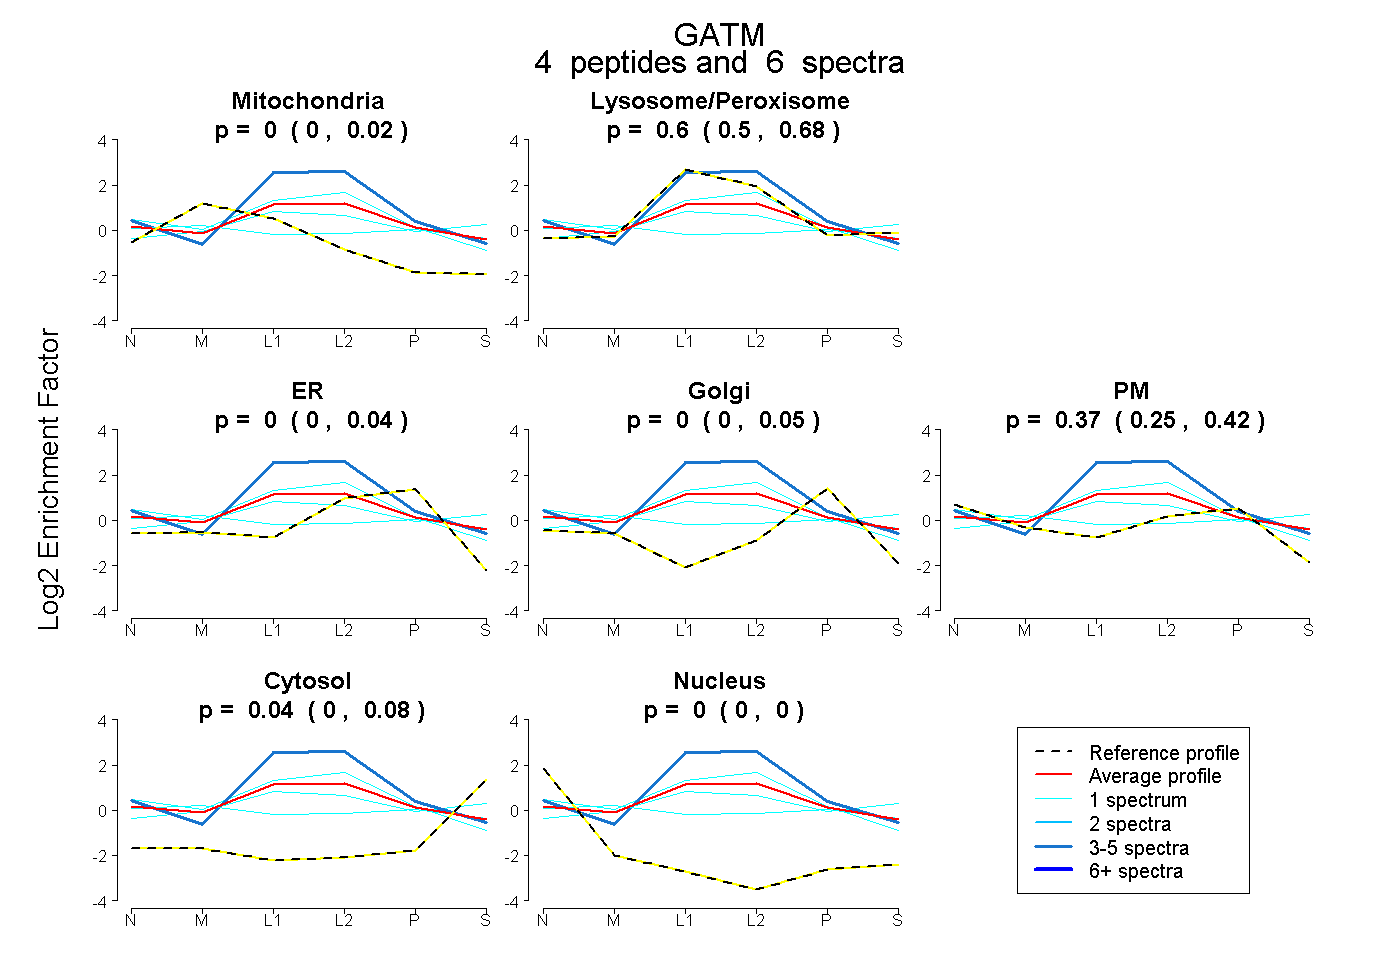 |
0.000 0.000 | 0.016 |
0.596 0.497 | 0.682 |
0.000 0.000 | 0.036 |
0.000 0.000 | 0.048 |
0.366 0.249 | 0.424 |
0.037 0.000 | 0.078 |
0.000 0.000 | 0.000 |
|||
| Plot | Lyso | Other | |||||||||||
| Expt C |
18 peptides |
300 spectra |
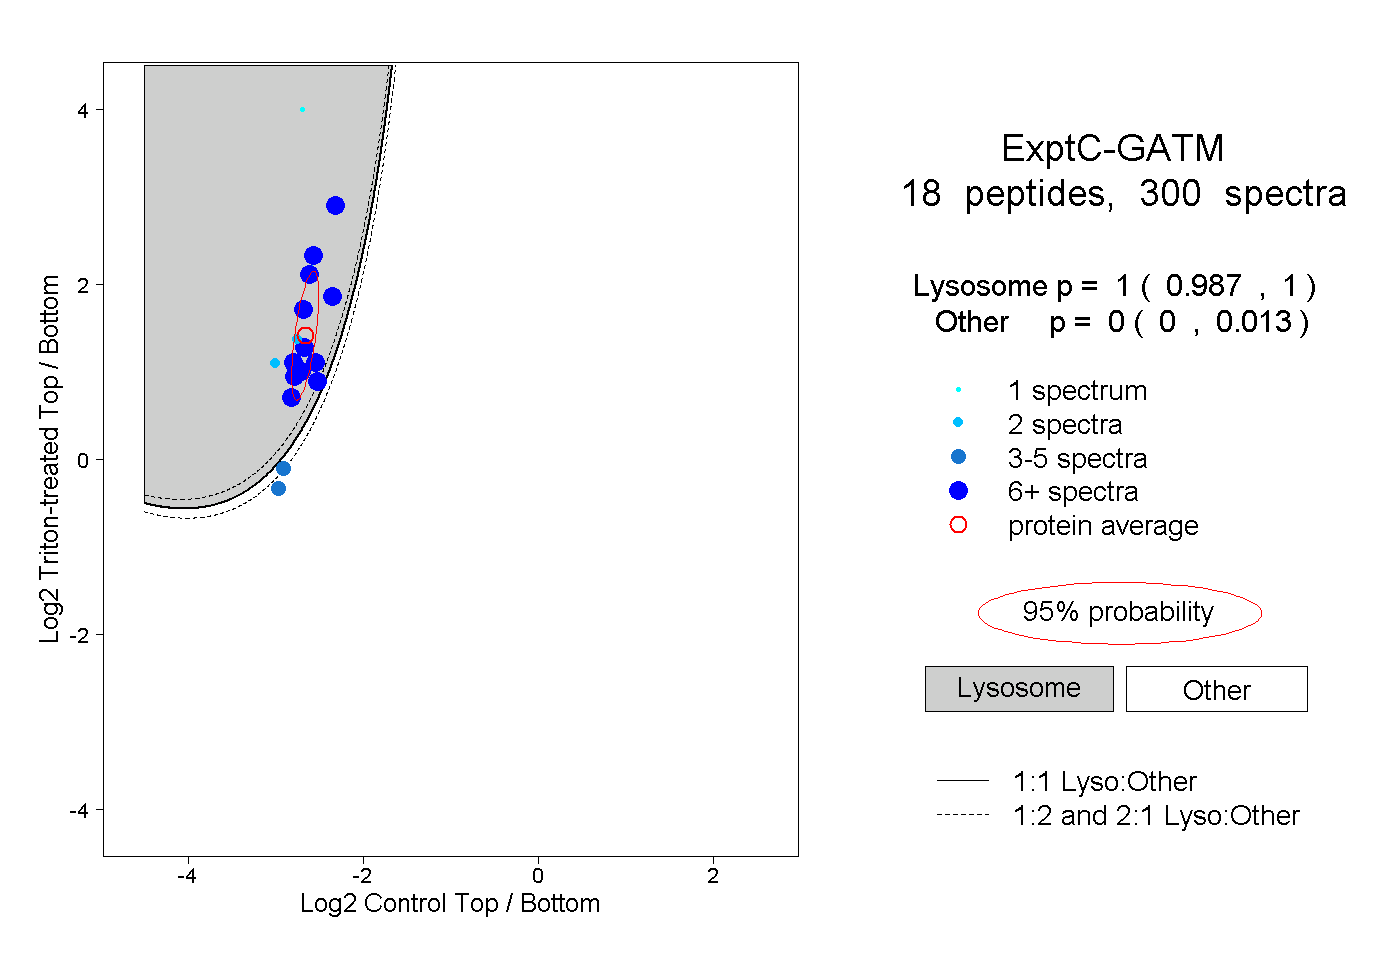 |
1.000 0.987 | 1.000 |
0.000 0.000 | 0.013 |
||||||||
| Plot | Lyso | Other | |||||||||||
| Expt D |
6 peptides |
15 spectra |
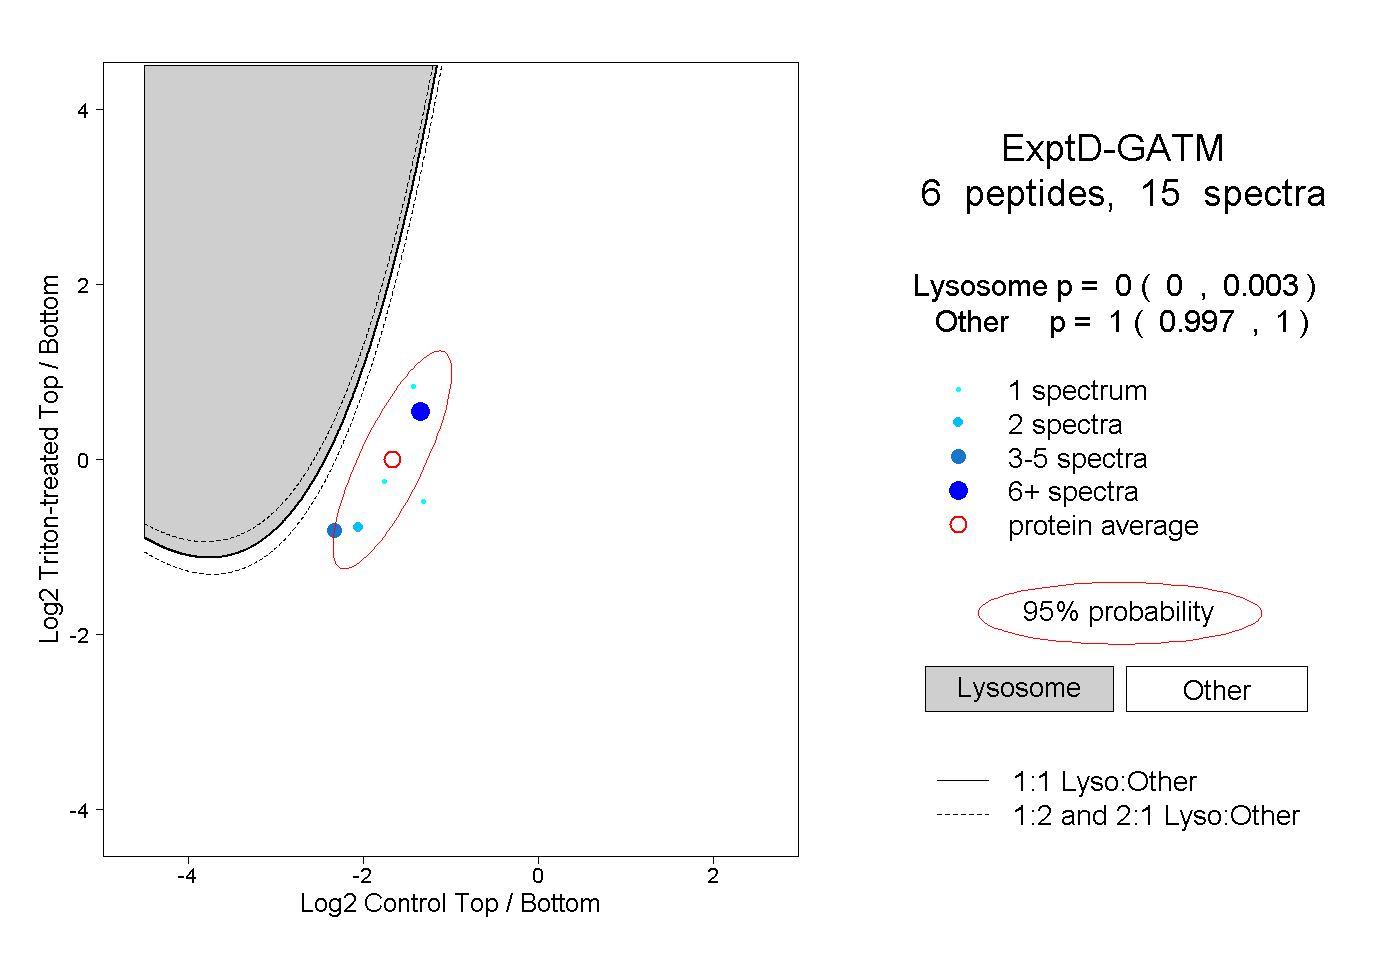 |
0.000 0.000 | 0.003 |
1.000 0.997 | 1.000 |