 3
3peptides
spectra
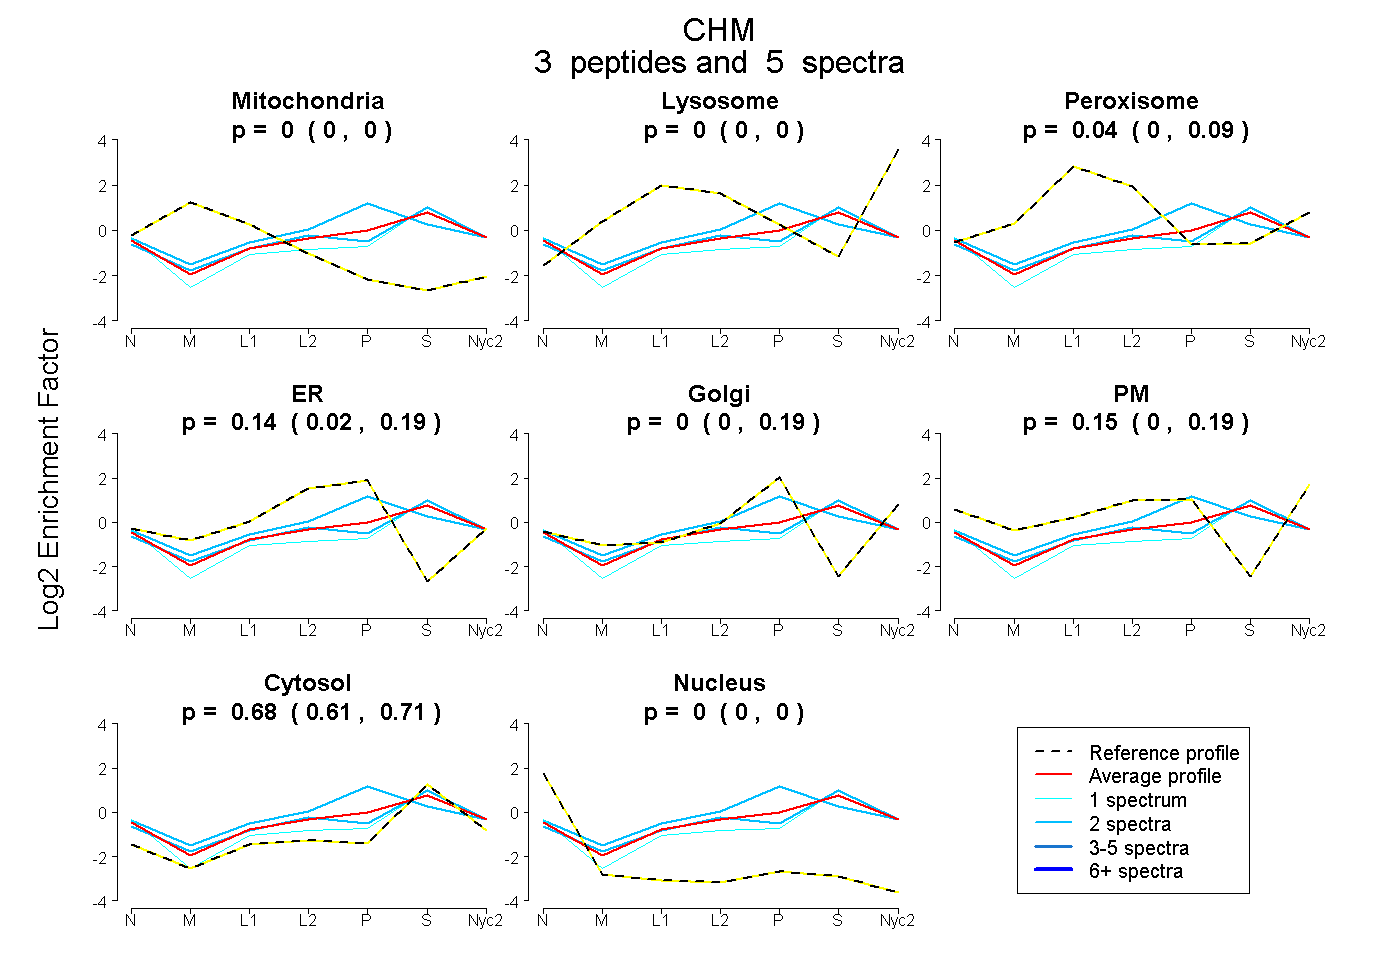
0.000 | 0.000
0.000 | 0.000
0.000 | 0.094
0.017 | 0.191
0.000 | 0.187
0.000 | 0.191
0.607 | 0.715
0.000 | 0.000
| Plot | Mito | Lyso | Perox | ER | Golgi | PM | Cytosol | Nucleus | |||||
| Expt A |
3 peptides |
5 spectra |
|
0.000 0.000 | 0.000 |
0.000 0.000 | 0.000 |
0.037 0.000 | 0.094 |
0.135 0.017 | 0.191 |
0.000 0.000 | 0.187 |
0.148 0.000 | 0.191 |
0.680 0.607 | 0.715 |
0.000 0.000 | 0.000 |
| 2 spectra, VLHVDSR | 0.000 | 0.000 | 0.121 | 0.050 | 0.000 | 0.115 | 0.715 | 0.000 | ||
| 2 spectra, AVLITDGSVLK | 0.000 | 0.000 | 0.063 | 0.289 | 0.195 | 0.000 | 0.452 | 0.000 | ||
| 1 spectrum, EGTVEQVPCSR | 0.000 | 0.000 | 0.000 | 0.000 | 0.000 | 0.176 | 0.824 | 0.000 |
| Plot | Lyso | Other | |||||||||||
| Expt C |
2 peptides |
3 spectra |
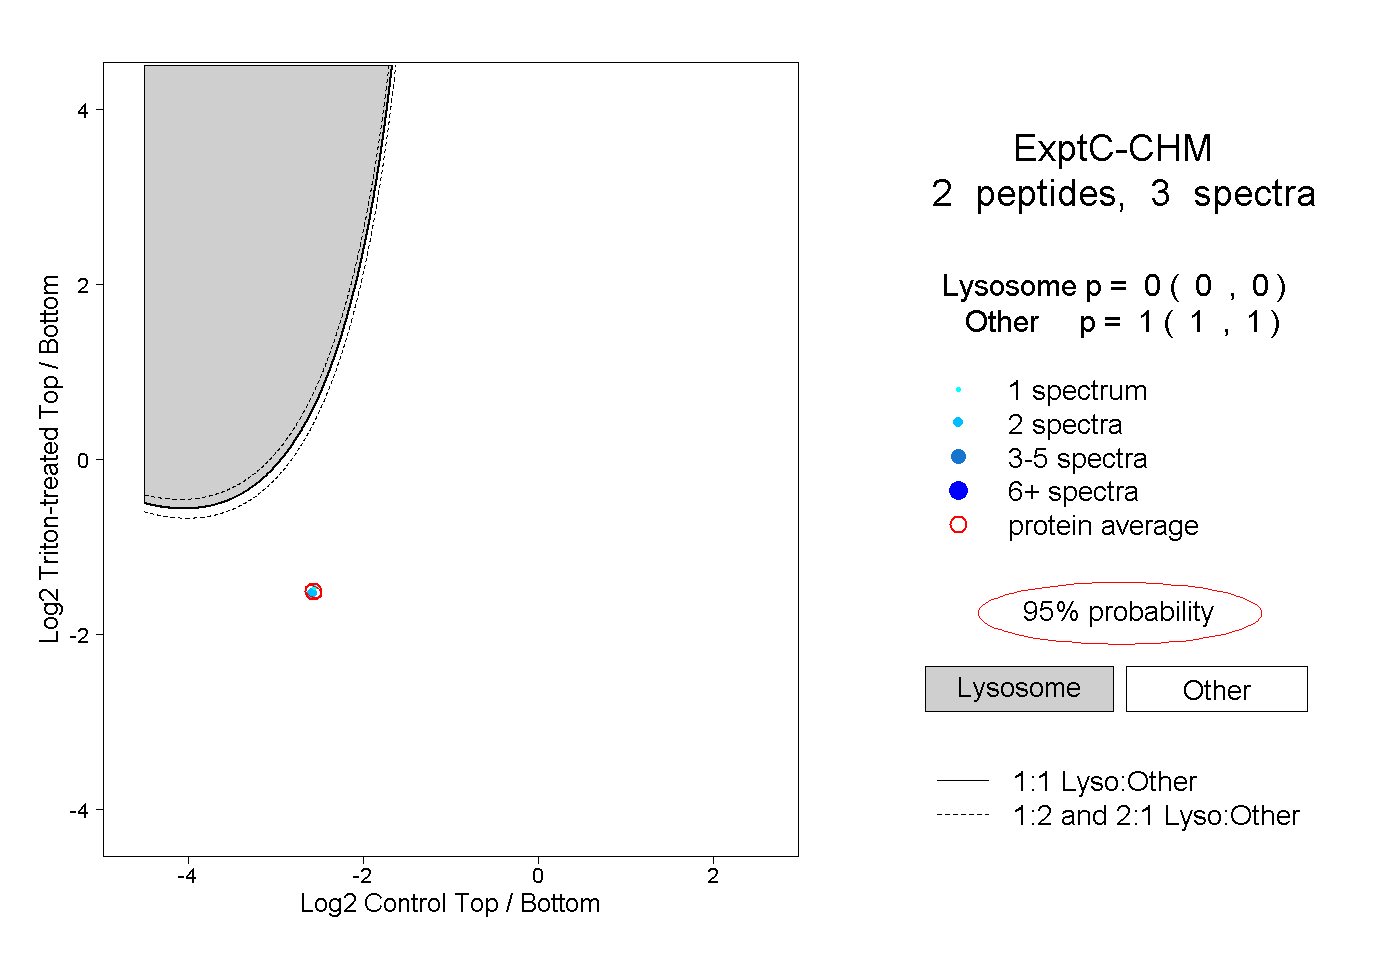 |
0.000 0.000 | 0.000 |
1.000 1.000 | 1.000 |