 11
11peptides
spectra
0.000 | 0.000
0.000 | 0.000
0.000 | 0.000
0.000 | 0.022
0.269 | 0.308
0.000 | 0.000
0.689 | 0.705
0.000 | 0.008
4peptides
spectra
0.000 | 0.000
1.000 | 1.000
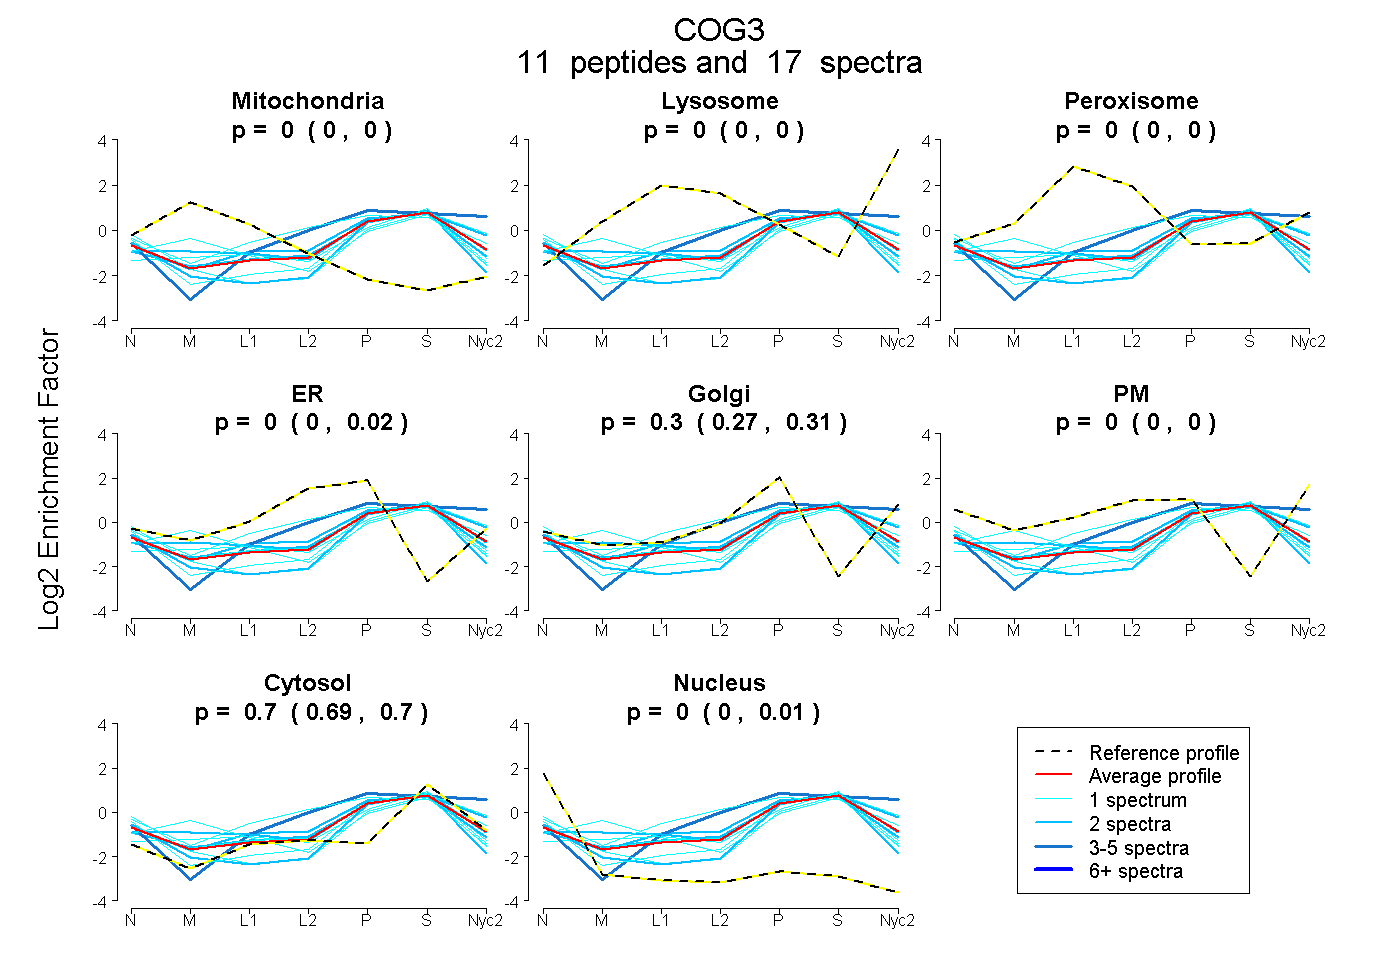
| Plot | Mito | Lyso | Perox | ER | Golgi | PM | Cytosol | Nucleus | |||||
| Expt A |
11 peptides |
17 spectra |
|
0.000 0.000 | 0.000 |
0.000 0.000 | 0.000 |
0.000 0.000 | 0.000 |
0.000 0.000 | 0.022 |
0.301 0.269 | 0.308 |
0.000 0.000 | 0.000 |
0.699 0.689 | 0.705 |
0.000 0.000 | 0.008 |
||
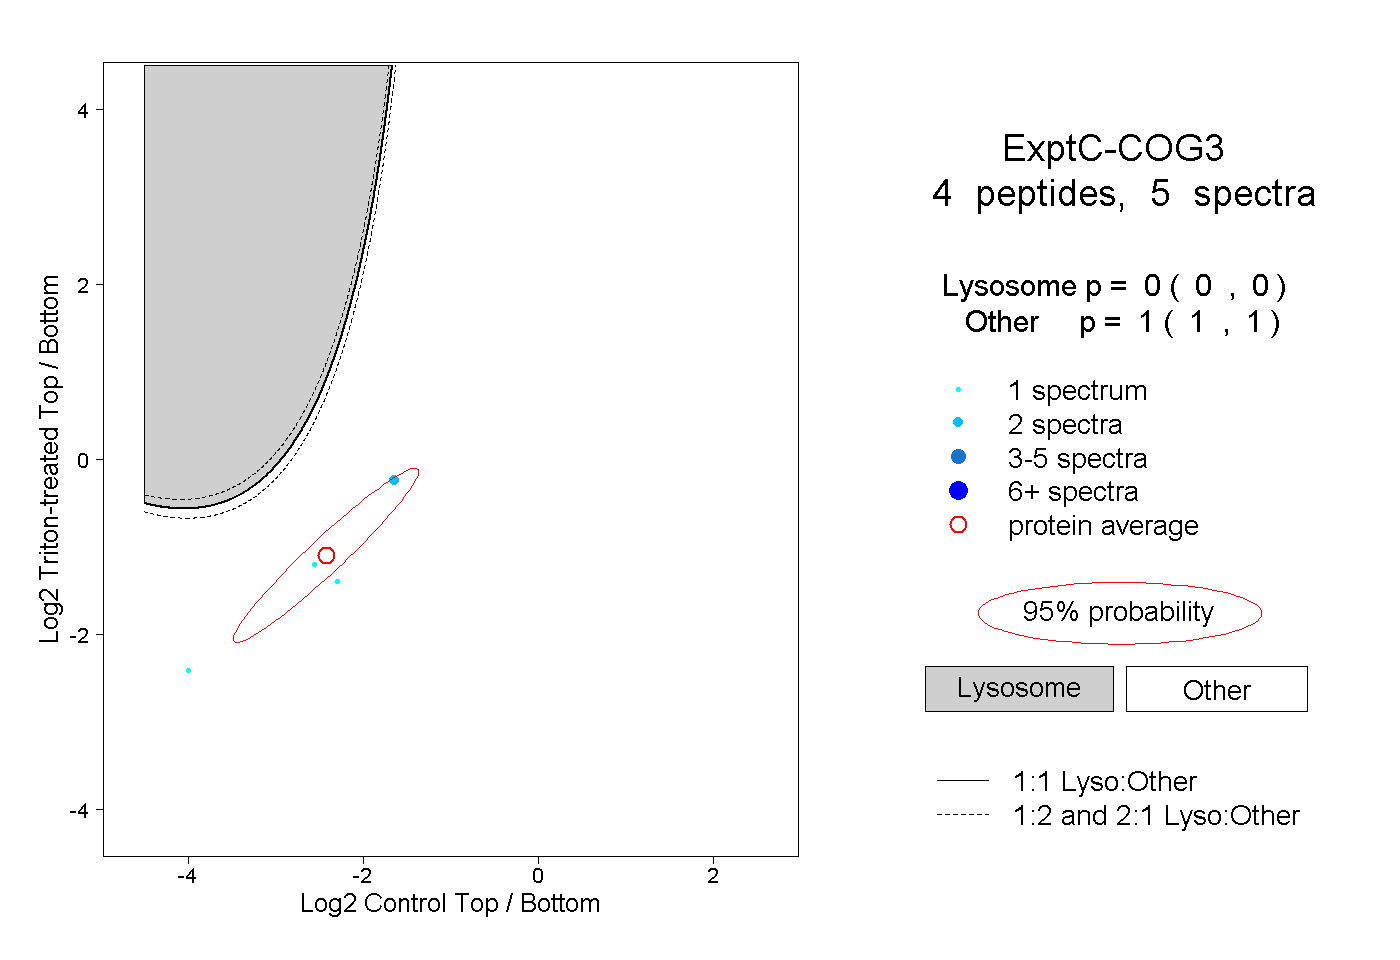
| Plot | Lyso | Other | |||||||||||
| Expt C |
4 peptides |
5 spectra |
|
0.000 0.000 | 0.000 |
1.000 1.000 | 1.000 |